|
The Division of Water Resources (DWR) provides the data contained within this
Local Water Supply Plan (LWSP) as a courtesy and service to our customers.
DWR staff does not field verify data. Neither DWR, nor any other party
involved in the preparation of this LWSP attests that the data is completely
free of errors and omissions. Furthermore, data users are cautioned that
LWSPs labeled PROVISIONAL have yet to be reviewed by DWR staff. Subsequent
review may result in significant revision. Questions regarding the accuracy
or limitations of usage of this data should be directed to the water system
and/or DWR.
1. System Information
Contact Information
Complete
| Water System Name: |
Bethel |
|
PWSID: |
04-74-030 |
| Mailing Address: | P.O. Box 337
Bethel, NC 27812 | Ownership: | Municipality |
| |
| Contact Person: | John Nelson | Title: | Public Works Director |
| Phone: | 252-818-0891 | Cell/Mobile: | 252-413-8739 |
Distribution System
| Line Type |
Size Range (Inches) |
Estimated % of lines |
| Asbestos Cement |
6 |
0.00 % |
| Cast Iron |
6-10 |
0.00 % |
| Galvanized Iron |
1-3 |
0.00 % |
| Polyvinyl Chloride |
1-6 |
0.00 % |
Bethel was unable to estimate a percentage of the primary types of distribution lines within the system. Programs
Water Conservation
2. Water Use Information
Service Area
| Sub-Basin(s) | % of Service Population |
|---|
| Tar River (15-1) | 0 % |
|
| County(s) | % of Service Population |
|---|
| Pitt | 0 % |
|
Water Use by Type
| Type of Use |
Metered
Connections |
Metered
Average Use (MGD) |
Non-Metered
Connections |
Non-Metered
Estimated Use (MGD) |
| Residential |
689 |
0.1060 |
0 |
0.0000 |
| Commercial |
47 |
0.0100 |
0 |
0.0000 |
| Industrial |
1 |
0.0080 |
0 |
0.0000 |
| Institutional |
0 |
0.0000 |
0 |
0.0000 |
How much water was used for system processes (backwash, line cleaning, flushing, etc.)? 0.0000 MGD
There were many errors within the 2002 billing data from Bethel. Bethel reported 1386 residential customers, which is almost double the users reported in 1997. However, it reported 837 sanitary sewer customers. The billed water total exceeded the pumped by more than double. Bethel was notified. More accurate data for 2002 could not be produced due to billing software complications. 2004 residential and commercial customers information was used to complete the LWSP. Assumed water usage per capita day to be 159.44 gallons and usage per commercial customer per day to be 222.22 gallons per day according to Bethel's 1997 LWSP.
Unaccounted for attributed to Municpal usage, system process water, and errors in Data. 3. Water Supply Sources
Monthly Withdrawals & Purchases
|
Average Daily
Use (MGD) |
Max Day
Use (MGD) |
|
Average Daily
Use (MGD) |
Max Day
Use (MGD) |
|
Average Daily
Use (MGD) |
Max Day
Use (MGD) |
| Jan |
0.1930 |
0.4430 |
May |
0.1900 |
0.3020 |
Sep |
0.1340 |
0.2090 |
| Feb |
0.1830 |
0.4410 |
Jun |
0.2120 |
0.3830 |
Oct |
0.1280 |
0.2420 |
| Mar |
0.1460 |
0.3960 |
Jul |
0.2140 |
0.5340 |
Nov |
0.1440 |
0.2390 |
| Apr |
0.1710 |
0.3180 |
Aug |
0.1520 |
0.2780 |
Dec |
0.1490 |
0.2530 |

Ground Water Sources
| Name or Number |
Average Daily Withdrawal (MGD) |
Max Day Withdrawal (MGD) |
12-Hour Supply
(MGD) |
CUA Reduction |
Year Offline |
Use Type |
| MGD |
Days Used |
| 2 |
0.1710 |
188 |
0.383 |
0.2130 |
CUA25 |
|
Regular |
| 3 |
0.1610 |
180 |
0.441 |
0.2180 |
CUA25 |
|
Regular |
Ground Water Sources (continued)
| Name or Number |
Well Depth (Feet) |
Casing Depth
(Feet) |
Screen Depth (Feet) |
Well Diameter (Inches) |
Pump Intake Depth (Feet) |
Metered? |
| Top |
Bottom |
| 2 |
380 |
240 |
240 |
330 |
6 |
177 |
Yes |
| 3 |
286 |
206 |
183 |
253 |
4 |
160 |
Yes |
4. Wastewater Information
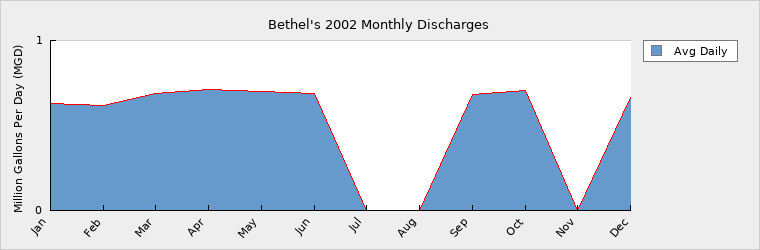
Monthly Discharges
|
Average Daily
Discharge (MGD) |
|
Average Daily
Discharge (MGD) |
|
Average Daily
Discharge (MGD) |
| Jan |
0.6310 |
May |
0.7020 |
Sep |
0.6820 |
| Feb |
0.6190 |
Jun |
0.6860 |
Oct |
0.7030 |
| Mar |
0.6900 |
Jul |
0.0000 |
Nov |
0.0000 |
| Apr |
0.7090 |
Aug |
0.0000 |
Dec |
0.6620 |
Wastewater Permits
| Permit Number |
Type |
Permitted Capacity
(MGD) |
Design Capacity
(MGD) |
Average Annual
Daily Discharge
(MGD) |
Maximum Day Discharge
(MGD) |
Receiving Stream |
Receiving Basin |
| NC0061514 |
|
0.7500 |
0.7500 |
0.6760 |
0.8710 |
Conetoe Creek |
Tar River (15-1) |
Bethel began discharge to Greenville Utlities in 2003. Wastewater Interconnections
| Water System |
PWSID |
Type |
Average Daily Amount |
Contract
Maximum (MGD) |
| MGD |
Days Used |
| Greenville Utilities Commission |
04-74-010 |
Discharging |
0.0000 |
0 |
0.3000 |
5. Planning
Projections
| |
2002 |
2010 |
2020 |
2030 |
| Year-Round Population |
1,675 |
1,886 |
2,123 |
2,390 |
| Seasonal Population |
0 |
0 |
0 |
0 |
| |
| Residential |
0.1060 |
0.1190 |
0.1380 |
0.1600 |
| Commercial |
0.0100 |
0.0120 |
0.0140 |
0.0160 |
| Industrial |
0.0080 |
0.0080 |
0.0080 |
0.0080 |
| Institutional |
0.0000 |
0.0000 |
0.0000 |
0.0000 |
| System Process |
0.0000 |
0.0000 |
0.0000 |
0.0000 |
| Unaccounted-for |
0.0435 |
0.0490 |
0.0550 |
0.0620 |
Used a 1.49% growth rate.Used 63.01 gpcd from 1997 plan for projection. The Wooten Company is currently developing a PER to explore future water sources for Bethel. Current plans are to replace most of the lines in the system and connect to Greenville Utilities with a 12" main down Highway 11. Funding is being sought from the USDA. Demand v/s Percent of Supply
| |
2002 |
2010 |
2020 |
2030 |
| Surface Water Supply |
0.0000 |
0.0000 |
0.0000 |
0.0000 |
| Ground Water Supply |
0.4310 |
0.3233 |
0.1078 |
0.1078 |
| Purchases |
0.0000 |
0.0000 |
0.0000 |
0.0000 |
| Future Supplies |
0.0000 |
0.0000 |
0.0000 |
| Total Available Supply (MGD) |
0.4310 |
0.3233 |
0.1000 |
0.1000 |
| Service Area Demand |
0.1675 |
0.1880 |
0.2150 |
0.2460 |
| Sales |
0.0000 |
0.0000 |
0.0000 |
0.0000 |
| Future Sales |
0.0000 |
0.0000 |
0.0000 |
| Total Demand (MGD) |
0.1675 |
0.1880 |
0.2150 |
0.2460 |
| Demand as Percent of Supply |
39% |
58% |
215% |
246% |

The purpose of the above chart is to show a general indication of how the long-term per capita water demand changes over time. The per capita water demand may actually be different than indicated due to seasonal populations and the accuracy of data submitted. Water systems that have calculated long-term per capita water demand based on a methodology that produces different results may submit their information in the notes field.
Your long-term water demand is 63 gallons per capita per day. What demand management practices do you plan to implement to reduce the per capita water demand (i.e. conduct regular water audits, implement a plumbing retrofit program, employ practices such as rainwater harvesting or reclaimed water)? If these practices are covered elsewhere in your plan, indicate where the practices are discussed here.
Are there other demand management practices you will implement to reduce your future supply needs?
What supplies other than the ones listed in future supplies are being considered to meet your future supply needs?
How does the water system intend to implement the demand management and supply planning components above?
Due to the Central Coastal Plain Capacity Use reductions, Bethel will reach >80% Demand as Percent of Supply in 2020. The Wooten Company is currently developing a PER to explore future water sources for Bethel. Current plans are to replace most of the lines in the system and connect to Greenville Utilities with a 12" main down Highway 11. Funding is being sought from the USDA. As of this time, a specific plan to address the demand exceedance has not been submitted. Additional Information
Has this system participated in regional water supply or water use planning? Yes
What major water supply reports or studies were used for planning?
Please describe any other needs or issues regarding your water supply sources, any water system deficiencies or needed improvements (storage, treatment, etc.) or your ability to meet present and future water needs. Include both quantity and quality considerations, as well as financial, technical, managerial, permitting, and compliance issues:
The Division of Water Resources (DWR) provides the data contained within this
Local Water Supply Plan (LWSP) as a courtesy and service to our customers.
DWR staff does not field verify data. Neither DWR, nor any other party
involved in the preparation of this LWSP attests that the data is completely
free of errors and omissions. Furthermore, data users are cautioned that
LWSPs labeled PROVISIONAL have yet to be reviewed by DWR staff. Subsequent
review may result in significant revision. Questions regarding the accuracy
or limitations of usage of this data should be directed to the water system
and/or DWR.
|