|
The Division of Water Resources (DWR) provides the data contained within this
Local Water Supply Plan (LWSP) as a courtesy and service to our customers.
DWR staff does not field verify data. Neither DWR, nor any other party
involved in the preparation of this LWSP attests that the data is completely
free of errors and omissions. Furthermore, data users are cautioned that
LWSPs labeled PROVISIONAL have yet to be reviewed by DWR staff. Subsequent
review may result in significant revision. Questions regarding the accuracy
or limitations of usage of this data should be directed to the water system
and/or DWR.
1. System Information
Contact Information
Complete
| Water System Name: |
Boiling Springs |
|
PWSID: |
01-23-025 |
| Mailing Address: | PO Box 1014
Boiling Springs, NC 28017 | Ownership: | Municipality |
| |
| Contact Person: | Mike Gibert | Title: | Public Works Director |
| Phone: | 704-434-2357 | Cell/Mobile: | 704-300-8640 |
| |
| Secondary Contact: | Zachary Parker | | Phone: | 704-434-2357 |
| Mailing Address: | PO Box 1014
Boiling Springs, NC 28017 | Cell/Mobile: | 704-300-8640 |
Distribution System
| Line Type |
Size Range (Inches) |
Estimated % of lines |
| Asbestos Cement |
6 |
2.00 % |
| Cast Iron |
6 |
4.00 % |
| Ductile Iron |
6-16 |
7.00 % |
| Polyvinyl Chloride |
2-12 |
87.00 % |
Programs
Water Conservation
2. Water Use Information
Service Area
| Sub-Basin(s) | % of Service Population |
|---|
| Broad River (01-1) | 100 % |
|
| County(s) | % of Service Population |
|---|
| Cleveland | 100 % |
|
Water Use by Type
| Type of Use |
Metered
Connections |
Metered
Average Use (MGD) |
Non-Metered
Connections |
Non-Metered
Estimated Use (MGD) |
| Residential |
1,794 |
0.2145 |
0 |
0.0000 |
| Commercial |
148 |
0.0415 |
0 |
0.0000 |
| Industrial |
1 |
0.0002 |
0 |
0.0000 |
| Institutional |
49 |
0.0818 |
0 |
0.0000 |
How much water was used for system processes (backwash, line cleaning, flushing, etc.)? 0.0040 MGD
System processes = estimated water main flushing, fire protection, fire department training and usage, and water leaks. Water Sales
| Purchaser |
PWSID |
Average
Daily Sold
(MGD) |
Days
Used |
Contract |
Required to
comply with water
use restrictions? |
Pipe Size(s)
(Inches) |
Use
Type |
| MGD |
Expiration |
Recurring |
| Cleveland County SD |
01-23-055 |
0.0000 |
0 |
|
|
Yes |
Yes |
6 |
Emergency |
3. Water Supply Sources
Monthly Withdrawals & Purchases
|
Average Daily
Use (MGD) |
Max Day
Use (MGD) |
|
Average Daily
Use (MGD) |
Max Day
Use (MGD) |
|
Average Daily
Use (MGD) |
Max Day
Use (MGD) |
| Jan |
0.3200 |
|
May |
0.3140 |
|
Sep |
0.4110 |
|
| Feb |
0.3390 |
|
Jun |
0.3490 |
|
Oct |
0.3980 |
|
| Mar |
0.3290 |
|
Jul |
0.4240 |
|
Nov |
0.3350 |
|
| Apr |
0.3890 |
|
Aug |
0.4150 |
|
Dec |
0.3080 |
|

Water Purchases From Other Systems
| Seller |
PWSID |
Average
Daily Purchased
(MGD) |
Days
Used |
Contract |
Required to
comply with water
use restrictions? |
Pipe Size(s)
(Inches) |
Use
Type |
| MGD |
Expiration |
Recurring |
| CLEVELAND COUNTY SD |
01-23-055 |
0.2070 |
5 |
0.0000 |
|
Yes |
Yes |
6 |
Emergency |
| SHELBY |
01-23-010 |
0.3670 |
365 |
1.0000 |
2034 |
Yes |
Yes |
16 |
Regular |
City of Shelby is the town regular connection. Cleveland County Water is an emergency connection. Boiling Springs confirms purchasing 0.207 MGD, averaged over five days, from Cleveland County. 4. Wastewater Information
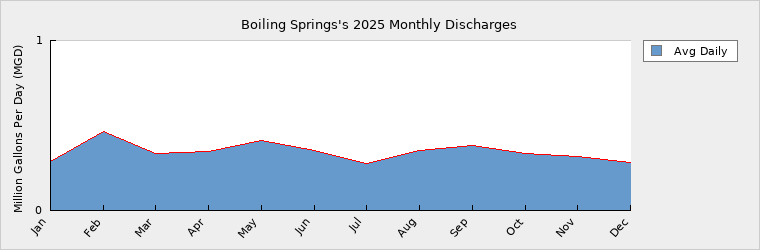
Monthly Discharges
|
Average Daily
Discharge (MGD) |
|
Average Daily
Discharge (MGD) |
|
Average Daily
Discharge (MGD) |
| Jan |
0.2910 |
May |
0.4130 |
Sep |
0.3800 |
| Feb |
0.4630 |
Jun |
0.3520 |
Oct |
0.3330 |
| Mar |
0.3330 |
Jul |
0.2740 |
Nov |
0.3150 |
| Apr |
0.3490 |
Aug |
0.3520 |
Dec |
0.2810 |
The Town W/S CIP recommends plans to upgrade wastewater treatment plant electric power voltage 208 three phase to 480 three phase, upgrades to aeration basin blowers and diffuser system, and a new digestor tank, these engineering plans and specifications are in progress. Wastewater Permits
| Permit Number |
Type |
Permitted Capacity
(MGD) |
Design Capacity
(MGD) |
Average Annual
Daily Discharge
(MGD) |
Maximum Day Discharge
(MGD) |
Receiving Stream |
Receiving Basin |
| NC0071943 |
WWTP |
0.6000 |
0.6000 |
0.3500 |
1.1000 |
SANDY RUN CREEK |
Broad River (01-1) |
| WQCS00222 |
CS |
0.0000 |
0.0000 |
0.0000 |
0.0000 |
COLLECTION SYSTEM |
Broad River (01-1) |
Wastewater Interconnections
| Water System |
PWSID |
Type |
Average Daily Amount |
Contract
Maximum (MGD) |
| MGD |
Days Used |
| Cleveland County SD |
01-23-055 |
Receiving |
0.0240 |
365 |
0.0750 |
The Town of Boiling Springs operates the sewer collection system and treats the wastewater from the Town of Lattimore. the water provider for the Town of Lattimore is Cleveland County SD Water System. 5. Planning
Projections
| |
2025 |
2030 |
2040 |
2050 |
2060 |
2070 |
| Year-Round Population |
4,700 |
4,725 |
4,730 |
4,750 |
4,775 |
4,800 |
| Seasonal Population |
0 |
0 |
0 |
0 |
0 |
0 |
| |
| Residential |
0.2145 |
0.2155 |
0.2200 |
0.2250 |
0.2300 |
0.2350 |
| Commercial |
0.0415 |
0.0465 |
0.0515 |
0.0565 |
0.0615 |
0.0665 |
| Industrial |
0.0002 |
0.0030 |
0.0040 |
0.0050 |
0.0060 |
0.0070 |
| Institutional |
0.0818 |
0.0828 |
0.0838 |
0.0848 |
0.0858 |
0.0868 |
| System Process |
0.0040 |
0.0065 |
0.0070 |
0.0075 |
0.0080 |
0.0085 |
| Unaccounted-for |
0.0278 |
0.0259 |
0.0268 |
0.0277 |
0.0286 |
0.0295 |
Demand v/s Percent of Supply
| |
2025 |
2030 |
2040 |
2050 |
2060 |
2070 |
| Surface Water Supply |
0.0000 |
0.0000 |
0.0000 |
0.0000 |
0.0000 |
0.0000 |
| Ground Water Supply |
0.0000 |
0.0000 |
0.0000 |
0.0000 |
0.0000 |
0.0000 |
| Purchases |
1.0000 |
1.0000 |
1.0000 |
1.0000 |
1.0000 |
1.0000 |
| Future Supplies |
0.0000 |
0.0000 |
0.0000 |
0.0000 |
0.0000 |
| Total Available Supply (MGD) |
1.0000 |
1.0000 |
1.0000 |
1.0000 |
1.0000 |
1.0000 |
| Service Area Demand |
0.3698 |
0.3802 |
0.3931 |
0.4065 |
0.4199 |
0.4333 |
| Sales |
0.0000 |
0.0000 |
0.0000 |
0.0000 |
0.0000 |
0.0000 |
| Future Sales |
0.0000 |
0.0000 |
0.0000 |
0.0000 |
0.0000 |
| Total Demand (MGD) |
0.3698 |
0.3802 |
0.3931 |
0.4065 |
0.4199 |
0.4333 |
| Demand as Percent of Supply |
37% |
38% |
39% |
41% |
42% |
43% |

The purpose of the above chart is to show a general indication of how the long-term per capita water demand changes over time. The per capita water demand may actually be different than indicated due to seasonal populations and the accuracy of data submitted. Water systems that have calculated long-term per capita water demand based on a methodology that produces different results may submit their information in the notes field.
Your long-term water demand is 46 gallons per capita per day. What demand management practices do you plan to implement to reduce the per capita water demand (i.e. conduct regular water audits, implement a plumbing retrofit program, employ practices such as rainwater harvesting or reclaimed water)? If these practices are covered elsewhere in your plan, indicate where the practices are discussed here.
No changes
Are there other demand management practices you will implement to reduce your future supply needs? The Town of Boiling Springs will work to reduce the per capita water use by water conservation public education, leak detection equipment, and an increasing block rate structure that encourages water conservation.
What supplies other than the ones listed in future supplies are being considered to meet your future supply needs? The Town of Boiling Springs future per capita demand will be evaluated annually and additional measures implemented to ensure usage is being maintained or reduced.
How does the water system intend to implement the demand management and supply planning components above? With technical assistance from NCRWA, NCDEQ, and contract engineering services.
Additional Information
Has this system participated in regional water supply or water use planning? No
What major water supply reports or studies were used for planning?
Please describe any other needs or issues regarding your water supply sources, any water system deficiencies or needed improvements (storage, treatment, etc.) or your ability to meet present and future water needs. Include both quantity and quality considerations, as well as financial, technical, managerial, permitting, and compliance issues:
The Division of Water Resources (DWR) provides the data contained within this
Local Water Supply Plan (LWSP) as a courtesy and service to our customers.
DWR staff does not field verify data. Neither DWR, nor any other party
involved in the preparation of this LWSP attests that the data is completely
free of errors and omissions. Furthermore, data users are cautioned that
LWSPs labeled PROVISIONAL have yet to be reviewed by DWR staff. Subsequent
review may result in significant revision. Questions regarding the accuracy
or limitations of usage of this data should be directed to the water system
and/or DWR.
|