|
The Division of Water Resources (DWR) provides the data contained within this
Local Water Supply Plan (LWSP) as a courtesy and service to our customers.
DWR staff does not field verify data. Neither DWR, nor any other party
involved in the preparation of this LWSP attests that the data is completely
free of errors and omissions. Furthermore, data users are cautioned that
LWSPs labeled PROVISIONAL have yet to be reviewed by DWR staff. Subsequent
review may result in significant revision. Questions regarding the accuracy
or limitations of usage of this data should be directed to the water system
and/or DWR.
1. System Information
Contact Information
Provisional
| Water System Name: |
Hot Springs |
|
PWSID: |
01-58-020 |
| Mailing Address: | PO Box 218
Hot Springs, NC 28743 | Ownership: | Municipality |
| |
| Contact Person: | Justin Wood | Title: | ORC |
| Phone: | 828-206-5355 | Cell/Mobile: | -- |
| |
| Secondary Contact: | Jordan Jackson | | Phone: | 336-596-3805 |
| Mailing Address: |
, | Cell/Mobile: | -- |
Distribution System
| Line Type |
Size Range (Inches) |
Estimated % of lines |
| Ductile Iron |
2-8 |
60.00 % |
| Polyvinyl Chloride |
2-8 |
40.00 % |
Town has 2 storage tanks, 0.5MG and 0.2MG. The Distribution Information was modified because in previous years, it included information for service lines, now the information only captures the water mains. Programs
Leaks are fixed as soon as they are found. NCRWA is used for Leak Detection when needed. Water Conservation
2. Water Use Information
Service Area
| Sub-Basin(s) | % of Service Population |
|---|
| French Broad River (05-2) | 100 % |
|
| County(s) | % of Service Population |
|---|
| Madison | 100 % |
|
Water Use by Type
| Type of Use |
Metered
Connections |
Metered
Average Use (MGD) |
Non-Metered
Connections |
Non-Metered
Estimated Use (MGD) |
| Residential |
235 |
0.0479 |
25 |
0.0010 |
| Commercial |
88 |
0.1487 |
0 |
0.0000 |
| Industrial |
0 |
0.0000 |
0 |
0.0000 |
| Institutional |
0 |
0.0000 |
0 |
0.0000 |
How much water was used for system processes (backwash, line cleaning, flushing, etc.)? 0.0002 MGD
System is still recovering from Helene damage. System completes billing every 2 months and February billing could not be used. Water consumption trended up all year and it will take one more year of data in the software to really know the consumption for this town because of Helene's damage to the town.
We estimate that consumption is higher that production due to the system being impacted by Helene, some meters had high production, we tried to not use that data, but there still might be some instances of high consumption that is not valid consumption. 3. Water Supply Sources
Monthly Withdrawals & Purchases
|
Average Daily
Use (MGD) |
Max Day
Use (MGD) |
|
Average Daily
Use (MGD) |
Max Day
Use (MGD) |
|
Average Daily
Use (MGD) |
Max Day
Use (MGD) |
| Jan |
0.1391 |
|
May |
0.1830 |
|
Sep |
0.2165 |
|
| Feb |
0.2850 |
|
Jun |
0.1555 |
|
Oct |
0.2132 |
|
| Mar |
0.1684 |
|
Jul |
0.1491 |
|
Nov |
0.1923 |
|
| Apr |
0.1630 |
|
Aug |
0.1436 |
|
Dec |
0.2010 |
|
May was estimated from average of year, data was not available. Contract operator operated system for January-June, Town took over operations fully in July. 
Ground Water Sources
| Name or Number |
Average Daily Withdrawal (MGD) |
Max Day Withdrawal (MGD) |
12-Hour Supply
(MGD) |
CUA Reduction |
Year Offline |
Use Type |
| MGD |
Days Used |
| 01 |
0.1800 |
365 |
|
0.1800 |
|
|
Regular |
| 02 |
0.1400 |
45 |
|
0.0750 |
|
|
Regular |
Ground Water Sources (continued)
| Name or Number |
Well Depth (Feet) |
Casing Depth
(Feet) |
Screen Depth (Feet) |
Well Diameter (Inches) |
Pump Intake Depth (Feet) |
Metered? |
| Top |
Bottom |
| 01 |
195 |
185 |
185 |
195 |
8 |
120 |
Yes |
| 02 |
375 |
224 |
0 |
0 |
6 |
120 |
Yes |
Town has been working with NCRWA to have a Wellhead Protection Plan and the draft was submitted for NCDEQ review in Feb. 2026. Town is fortunate that the wells are not located in flood area and the area is mostly undeveloped. Well records information was used to update the well information. Water Treatment Plants
| Plant Name |
Permitted Capacity
(MGD) |
Is Raw Water Metered? |
Is Finished Water Ouput Metered? |
Source |
| Town of Hot Springs |
0.2500 |
Yes |
Yes |
well# 1 and 2 |
4. Wastewater Information
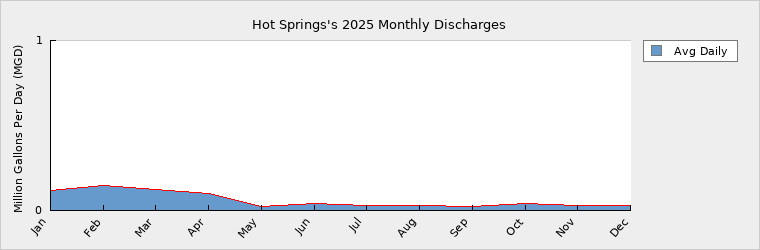
Monthly Discharges
|
Average Daily
Discharge (MGD) |
|
Average Daily
Discharge (MGD) |
|
Average Daily
Discharge (MGD) |
| Jan |
0.1177 |
May |
0.0229 |
Sep |
0.0239 |
| Feb |
0.1459 |
Jun |
0.0410 |
Oct |
0.0397 |
| Mar |
0.1246 |
Jul |
0.0294 |
Nov |
0.0299 |
| Apr |
0.0997 |
Aug |
0.0281 |
Dec |
0.0304 |
Wastewater Permits
| Permit Number |
Type |
Permitted Capacity
(MGD) |
Design Capacity
(MGD) |
Average Annual
Daily Discharge
(MGD) |
Maximum Day Discharge
(MGD) |
Receiving Stream |
Receiving Basin |
| NC0025836 |
WWTP |
0.8000 |
0.8000 |
0.1000 |
0.9000 |
French Broad |
French Broad River (05-2) |
| NC0049620 |
WWTP |
0.0100 |
0.0100 |
0.0020 |
0.0050 |
French Broad |
French Broad River (05-2) |
NC0049620 is a sand filter and treats WW from 40 Housing Authority units. it was replaced in March 2025. 5. Planning
Projections
| |
2025 |
2030 |
2040 |
2050 |
2060 |
2070 |
| Year-Round Population |
900 |
980 |
995 |
1,005 |
1,015 |
1,025 |
| Seasonal Population |
1,500 |
1,600 |
1,700 |
1,800 |
1,900 |
2,000 |
| |
| Residential |
0.0489 |
0.0481 |
0.0485 |
0.0489 |
0.0493 |
0.0497 |
| Commercial |
0.1487 |
0.1533 |
0.1546 |
0.1558 |
0.1571 |
0.1584 |
| Industrial |
0.0000 |
0.0000 |
0.0000 |
0.0000 |
0.0000 |
0.0000 |
| Institutional |
0.0000 |
0.0000 |
0.0000 |
0.0000 |
0.0000 |
0.0000 |
| System Process |
0.0002 |
0.0002 |
0.0002 |
0.0002 |
0.0002 |
0.0002 |
| Unaccounted-for |
-0.0005 |
0.0500 |
0.0500 |
0.0500 |
0.0500 |
0.0500 |
Stayed tuned for 2026 number as this town gets more and better data.
Population includes new connection to Fairview which will add 80 people to the population.
We understand that the unaccounted for water is currently negative but the town is in the process of planning to install to AMR meters and that will dramatically improve consumption data for the town.
It would not let me submit the plan, so I modified the Commercial usage, I subtracted 0.004 so that it will be exactly 0% unaccounted for water. Future Water Sales
| Purchaser |
PWSID |
Contract |
Pipe Size(s) (Inches) |
Use Type |
| MGD |
Year Begin |
Year End |
| Fairview Water System |
01-58-025 |
0.0020 |
2026 |
|
|
Regular |
This interconnection will serve 30 connections. Future Supply Sources
| Source Name |
PWSID |
Source Type |
Additional Supply |
Year Online |
Year Offline |
Type |
| Hot Springs |
01-58-020 |
Ground |
0.1200 |
2028 |
|
Regular |
System needs an additional well for additional supply and redundancy. Demand v/s Percent of Supply
| |
2025 |
2030 |
2040 |
2050 |
2060 |
2070 |
| Surface Water Supply |
0.0000 |
0.0000 |
0.0000 |
0.0000 |
0.0000 |
0.0000 |
| Ground Water Supply |
0.2550 |
0.2550 |
0.2550 |
0.2550 |
0.2550 |
0.2550 |
| Purchases |
0.0000 |
0.0000 |
0.0000 |
0.0000 |
0.0000 |
0.0000 |
| Future Supplies |
0.1200 |
0.1200 |
0.1200 |
0.1200 |
0.1200 |
| Total Available Supply (MGD) |
0.2550 |
0.3750 |
0.3750 |
0.3750 |
0.3750 |
0.3750 |
| Service Area Demand |
0.1973 |
0.2516 |
0.2533 |
0.2549 |
0.2566 |
0.2583 |
| Sales |
0.0000 |
0.0000 |
0.0000 |
0.0000 |
0.0000 |
0.0000 |
| Future Sales |
0.0020 |
0.0020 |
0.0020 |
0.0020 |
0.0020 |
| Total Demand (MGD) |
0.1973 |
0.2536 |
0.2553 |
0.2569 |
0.2586 |
0.2603 |
| Demand as Percent of Supply |
77% |
68% |
68% |
69% |
69% |
69% |

The purpose of the above chart is to show a general indication of how the long-term per capita water demand changes over time. The per capita water demand may actually be different than indicated due to seasonal populations and the accuracy of data submitted. Water systems that have calculated long-term per capita water demand based on a methodology that produces different results may submit their information in the notes field.
Your long-term water demand is 54 gallons per capita per day. What demand management practices do you plan to implement to reduce the per capita water demand (i.e. conduct regular water audits, implement a plumbing retrofit program, employ practices such as rainwater harvesting or reclaimed water)? If these practices are covered elsewhere in your plan, indicate where the practices are discussed here.
Conduct regular scans of billing to identify and confirm top water users, this can help the town identify leaks on the customer side.
Are there other demand management practices you will implement to reduce your future supply needs? The town is looking into new customer water meter options and this will help identify leaks on the customer side much faster.
What supplies other than the ones listed in future supplies are being considered to meet your future supply needs? The town understands the need for an additional well for added supply.
How does the water system intend to implement the demand management and supply planning components above? The town has been awarded SRF Helene money and that will help the town recover from the impact of Helene but also will make the town more resilient.
Additional Information
Has this system participated in regional water supply or water use planning? No
What major water supply reports or studies were used for planning?
Please describe any other needs or issues regarding your water supply sources, any water system deficiencies or needed improvements (storage, treatment, etc.) or your ability to meet present and future water needs. Include both quantity and quality considerations, as well as financial, technical, managerial, permitting, and compliance issues:
The Division of Water Resources (DWR) provides the data contained within this
Local Water Supply Plan (LWSP) as a courtesy and service to our customers.
DWR staff does not field verify data. Neither DWR, nor any other party
involved in the preparation of this LWSP attests that the data is completely
free of errors and omissions. Furthermore, data users are cautioned that
LWSPs labeled PROVISIONAL have yet to be reviewed by DWR staff. Subsequent
review may result in significant revision. Questions regarding the accuracy
or limitations of usage of this data should be directed to the water system
and/or DWR.
|