|
The Division of Water Resources (DWR) provides the data contained within this
Local Water Supply Plan (LWSP) as a courtesy and service to our customers.
DWR staff does not field verify data. Neither DWR, nor any other party
involved in the preparation of this LWSP attests that the data is completely
free of errors and omissions. Furthermore, data users are cautioned that
LWSPs labeled PROVISIONAL have yet to be reviewed by DWR staff. Subsequent
review may result in significant revision. Questions regarding the accuracy
or limitations of usage of this data should be directed to the water system
and/or DWR.
1. System Information
Contact Information
Complete
| Water System Name: |
Charlotte Water |
|
PWSID: |
01-60-010 |
| Mailing Address: | 5100 Brookshire Blvd.
Charlotte, NC 28216 | Ownership: | County |
| |
| Contact Person: | Charles Thach | Title: | Engineering Project Coordinator |
| Phone: | 980-346-2713 | Cell/Mobile: | -- |
| |
| Secondary Contact: | Bhavana Swayampakala | | Phone: | 980-240-8801 |
| Mailing Address: | 5100 Brookshire Blvd.
Charlotte, NC 28216 | Cell/Mobile: | -- |
Distribution System
| Line Type |
Size Range (Inches) |
Estimated % of lines |
| Asbestos Cement |
3-10 |
1.01 % |
| Cast Iron |
1-42 |
21.89 % |
| Ductile Iron |
1-66 |
20.87 % |
| Galvanized Iron |
3/4-6 |
2.33 % |
| Other |
1-96 |
1.56 % |
| Polyvinyl Chloride |
1-24 |
52.34 % |
Meters for outdoor water use include active and inactive accounts for lawn irrigation, smart-metering irrigation, and swimming pools. Programs
-Select hydrants are flushed by either manual operation or by automatic flushing devices located throughout the system as needed to maintain water quality. In addition, all hydrants are inspected/flushed at a minimum of every 2 years by the City of Charlotte and Mecklenburg County Fire Departments.
-Valve exercise program is conducted on a continuous basis. Annual operation is targeted with an emphasis on 12-inch and larger valves.
-Locating and repairing large leaks is a derivative of the objectives set forth in the Revenue Recovery Program. Existing master meters have been calibrated and new meters have been installed to monitor consumption by pressure zone to help identify potential water losses by regional service area. In addition a pilot test is underway that will include the field installation of leak detection devices, a study of information collected, and evaluation of their potential cost effectiveness as an additional tool to support Charlotte Water's water loss control efforts. Water Conservation
A reuse line by the University of North Carolina at Charlotte was completed in 2023 but not active for the 2023 calendar year. The Mallard Creek Wastewater Treatment Plant reclamation line is currently offline with plans to be activated in the summer of 2024. 2. Water Use Information
Service Area
| Sub-Basin(s) | % of Service Population |
|---|
| Catawba River (03-1) | 85 % |
| Rocky River (18-4) | 15 % |
|
| County(s) | % of Service Population |
|---|
| Mecklenburg | 100 % |
|
Davidson Point, which was previously on a private regulated well system, was acquired by Charlotte Water. In February 2023, a pipeline connection was completed to integrate Davidson Point into the Charlotte Water Distribution System. 166 residential service connections were established and is now supplied and operated by Charlotte water. Water Use by Type
| Type of Use |
Metered
Connections |
Metered
Average Use (MGD) |
Non-Metered
Connections |
Non-Metered
Estimated Use (MGD) |
| Residential |
301,948 |
66.0500 |
0 |
0.0000 |
| Commercial |
25,177 |
21.2700 |
0 |
0.0000 |
| Industrial |
291 |
2.8800 |
0 |
0.0000 |
| Institutional |
2,466 |
5.2000 |
0 |
0.0000 |
How much water was used for system processes (backwash, line cleaning, flushing, etc.)? 10.3100 MGD
Metered connections are based on the number of active and inactive connections at the time of query. Average meter use is based on active account usage at the time of query for calendar year 2023. Residential meters include separate outdoor irrigation accounts. Commercial connections include outdoor irrigation accounts.
System water was calculated as summation of estimated water losses associated with hydrant flushing, autoflushers, and water main projects along with the difference between water withdraws from Mt. Island Lake and Lake Norman and the actual treated water pumped by the three water treatment plants (Franklin, Lee Dukes, and Vest). The difference takes into account evaporative losses, treatment of filter process water, and plant maintenance water, among others. Value excludes any water returned under NPDES permits. Water Sales
| Purchaser |
PWSID |
Average
Daily Sold
(MGD) |
Days
Used |
Contract |
Required to
comply with water
use restrictions? |
Pipe Size(s)
(Inches) |
Use
Type |
| MGD |
Expiration |
Recurring |
| Concord |
01-13-010 |
2.5800 |
2 |
5.0000 |
|
Yes |
Yes |
12/16 |
Regular |
| Lancaster Co. |
00-00-000 |
0.1648 |
365 |
0.1500 |
2097 |
Yes |
Yes |
16 |
Regular |
| Town of Harrisburg |
01-13-025 |
0.0445 |
365 |
|
|
Yes |
Yes |
8/12 |
Regular |
| Union Co |
01-90-413 |
0.0000 |
41 |
0.5000 |
|
Yes |
Yes |
12 |
Emergency |
| York County, South Carolina |
00-00-000 |
0.2113 |
365 |
5.0000 |
|
|
Yes |
8 |
Regular |
The Concord Water Supply Agreement is on a 5-year auto renewal contract. Both parties agree to provide the other a total maximum of 5 million gallons of water per day (MGD). The Harrisburg Water Supply Agreement has no stated volume limit and no term as they are treated as any other Charlotte Water customer. The Union County Water Supply Agreement requires a written termination request.
Charlotte Water may provide water service to private systems and separate regulated utilities such as Aqua NC, Inc, Carolina Water Service, etc. No contracts exists between the City of Charlotte and these utilities. Service is provided to these public water systems in the same manner that service is provided to other Charlotte Water customers.
The consumption for Union County was spread through 41 days of usage. The total amount is 2850 Gallons so the value is not significant enough to be reflected in MGD in the table shown above. 3. Water Supply Sources
Monthly Withdrawals & Purchases
|
Average Daily
Use (MGD) |
Max Day
Use (MGD) |
|
Average Daily
Use (MGD) |
Max Day
Use (MGD) |
|
Average Daily
Use (MGD) |
Max Day
Use (MGD) |
| Jan |
108.8980 |
120.3430 |
May |
120.5110 |
145.1350 |
Sep |
134.4460 |
170.0760 |
| Feb |
102.9740 |
117.0920 |
Jun |
124.1020 |
161.4790 |
Oct |
136.7340 |
155.8680 |
| Mar |
104.5660 |
116.4360 |
Jul |
137.0530 |
184.6330 |
Nov |
121.6360 |
144.2550 |
| Apr |
109.1240 |
127.7540 |
Aug |
135.1080 |
181.0110 |
Dec |
108.0900 |
141.8660 |

Surface Water Sources
| Stream |
Reservoir |
Average Daily Withdrawal |
Maximum Day
Withdrawal (MGD) |
Available Raw
Water Supply |
Usable On-Stream
Raw Water Supply
Storage (MG) |
| MGD |
Days Used |
MGD |
* Qualifier |
| Catawba River |
Lake Norman |
20.2340 |
365 |
0.0000 |
108.0000 |
C |
0.0000 |
| Catawba River |
Mt. Island Lake |
100.1560 |
365 |
0.0000 |
163.0000 |
T |
0.0000 |
* Qualifier: C=Contract Amount, SY20=20-year Safe Yield, SY50=50-year Safe Yield, F=20% of 7Q10 or other instream flow requirement, CUA=Capacity Use Area Permit
Surface Water Sources (continued)
| Stream |
Reservoir |
Drainage Area
(sq mi) |
Metered? |
Sub-Basin |
County |
Year
Offline |
Use
Type |
| Catawba River |
Lake Norman |
1,790 |
Yes |
Catawba River (03-1) |
Mecklenburg |
|
Regular |
| Catawba River |
Mt. Island Lake |
1,860 |
Yes |
Catawba River (03-1) |
Mecklenburg |
|
Regular |
Available Raw Water Supply amounts are based on combination of treatment and pumping capacities along with FERC withdrawal authorizations. The current FERC authorization with Lake Norman granted construction of an 108 MGD water intake facility. This intake is currently serving the Lee S. Dukes WTP with a permitted treatment capacity of 25.25 MGD. The current FERC authorization for withdrawing from Mountain Island Lake stipulates an instantaneous rate of 330 MGD, while maintaining an average annual withdrawal limit of 163 MGD.
Charlotte Water currently has a 33.0 MGD Maximum Day IBT to transfer water from the Catawba River to the Rocky River basin. Water Purchases From Other Systems
| Seller |
PWSID |
Average
Daily Purchased
(MGD) |
Days
Used |
Contract |
Required to
comply with water
use restrictions? |
Pipe Size(s)
(Inches) |
Use
Type |
| MGD |
Expiration |
Recurring |
| City of Concord |
01-13-010 |
0.0000 |
0 |
1.0000 |
|
Yes |
Yes |
12 |
Regular |
Water Treatment Plants
| Plant Name |
Permitted Capacity
(MGD) |
Is Raw Water Metered? |
Is Finished Water Ouput Metered? |
Source |
| Franlkin WTP |
181.0000 |
Yes |
Yes |
Catawba (Mt. Island Lake) |
| Lee S. Dukes WTP |
25.2500 |
Yes |
Yes |
Catawba (Lake Norman) |
| Vest WTP |
24.0000 |
Yes |
Yes |
Catawba (Mt. Island Lake) |
Charlotte Water contracted with Black and Veatch to conduct the 2015 Water Distribution System Master Plan. The Plan forecasts demands and capacity needs into 2040. One outcome from this evaluation is an expansion of our Lee S. Dukes WTP by 25 MGD. This increase will be covered under our current FERC permitting for a 108 MGD intake currently on Lake Norman. 4. Wastewater Information
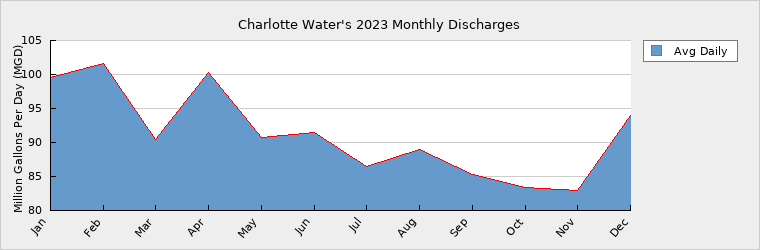
Monthly Discharges
|
Average Daily
Discharge (MGD) |
|
Average Daily
Discharge (MGD) |
|
Average Daily
Discharge (MGD) |
| Jan |
99.5394 |
May |
90.7501 |
Sep |
85.2620 |
| Feb |
101.6461 |
Jun |
91.4788 |
Oct |
83.3343 |
| Mar |
90.3918 |
Jul |
86.4439 |
Nov |
82.9371 |
| Apr |
100.2643 |
Aug |
88.9658 |
Dec |
93.9415 |
Preliminary design and permitting is underway for the Stowe Regional Water Resource Recovery Facility (Long Creek WWTP in 2018 report).
Water service connections with septic systems estimated as number of accounts for domestic-use connections without associated sewer accounts. These counts exclude wholesale, fire line, swimming pool, and irrigation connections.
Wastewater Permits
| Permit Number |
Type |
Permitted Capacity
(MGD) |
Design Capacity
(MGD) |
Average Annual
Daily Discharge
(MGD) |
Maximum Day Discharge
(MGD) |
Receiving Stream |
Receiving Basin |
| NC0024937 |
WWTP |
20.0000 |
20.0000 |
14.9417 |
|
Little Sugar Creek |
Catawba River (03-1) |
| NC0024945 |
WWTP |
15.0000 |
15.0000 |
14.1667 |
|
Irwin Creek |
Catawba River (03-1) |
| NC0024970 |
WWTP |
64.0000 |
64.0000 |
41.0333 |
|
McAlpine Creek |
Catawba River (03-1) |
| NC0030210 |
WWTP |
13.1000 |
13.1000 |
10.3167 |
|
Mallard Creek |
Rocky River (18-4) |
| NC0036277 |
WWTP |
12.0000 |
12.0000 |
5.8333 |
|
McDowell Creek |
Catawba River (03-1) |
| NC0065749 |
WWTP |
0.1000 |
0.1000 |
0.0475 |
|
Duck Creek |
Rocky River (18-4) |
Wastewater Interconnections
| Water System |
PWSID |
Type |
Average Daily Amount |
Contract
Maximum (MGD) |
| MGD |
Days Used |
| WSACC |
01-13-020 |
Discharging |
4.9840 |
365 |
7.4000 |
| Union County |
01-90-413 |
Receiving |
1.8615 |
365 |
3.0000 |
5. Planning
Projections
| |
2023 |
2030 |
2040 |
2050 |
2060 |
2070 |
| Year-Round Population |
1,141,130 |
1,216,901 |
1,373,880 |
1,566,223 |
1,785,494 |
2,035,464 |
| Seasonal Population |
0 |
0 |
0 |
0 |
0 |
0 |
| |
| Residential |
66.0500 |
70.4400 |
72.8000 |
83.0000 |
94.6000 |
107.9000 |
| Commercial |
21.2700 |
22.7200 |
25.8000 |
29.7000 |
34.1000 |
39.2000 |
| Industrial |
2.8800 |
3.0800 |
3.5000 |
4.0200 |
4.6200 |
5.2000 |
| Institutional |
5.2000 |
5.5600 |
6.3100 |
7.2600 |
8.3400 |
9.4000 |
| System Process |
10.3100 |
11.0100 |
12.5200 |
14.3900 |
26.1000 |
18.6300 |
| Unaccounted-for |
14.2453 |
15.2021 |
16.2963 |
18.6465 |
22.6071 |
24.3010 |
-Based on the 2012 US Census Bureau data for Mecklenburg County, the average household size is 2.5.
-2020 - 2040 service populations are based on Charlotte Regional Transportation Planning Organization (CRTPO) Traffic Analysis Zone (TAZ) based population increases. All population growth was assumed to be served by Charlotte Water.
-2050 and 2060 service populations are assumed to be steady 1.4% population growth from CRTPO projections.
-The per capita residential demand is based on an observed average consumption of 63.5 gcpd (2016 - 2020). This value has decreased and is projected to decrease to 53 GPD in 2025 (as presented in Charlotte Water's 2015 Water Distribution System Master Plan conducted by Black and Veatch).
-Remaining, non-residential demand was assumed to grow at the same rate as population. Demand v/s Percent of Supply
| |
2023 |
2030 |
2040 |
2050 |
2060 |
2070 |
| Surface Water Supply |
271.0000 |
271.0000 |
271.0000 |
271.0000 |
271.0000 |
271.0000 |
| Ground Water Supply |
0.0000 |
0.0000 |
0.0000 |
0.0000 |
0.0000 |
0.0000 |
| Purchases |
1.0000 |
1.0000 |
1.0000 |
1.0000 |
1.0000 |
1.0000 |
| Future Supplies |
0.0000 |
0.0000 |
0.0000 |
0.0000 |
0.0000 |
| Total Available Supply (MGD) |
272.0000 |
272.0000 |
272.0000 |
272.0000 |
272.0000 |
272.0000 |
| Service Area Demand |
119.9553 |
128.0121 |
137.2263 |
157.0165 |
190.3671 |
204.6310 |
| Sales |
0.4347 |
10.2093 |
10.2093 |
10.2093 |
10.2093 |
10.2093 |
| Future Sales |
0.0000 |
0.0000 |
0.0000 |
0.0000 |
0.0000 |
| Total Demand (MGD) |
120.3900 |
138.2214 |
147.4356 |
167.2258 |
200.5764 |
214.8403 |
| Demand as Percent of Supply |
44% |
51% |
54% |
61% |
74% |
79% |

The purpose of the above chart is to show a general indication of how the long-term per capita water demand changes over time. The per capita water demand may actually be different than indicated due to seasonal populations and the accuracy of data submitted. Water systems that have calculated long-term per capita water demand based on a methodology that produces different results may submit their information in the notes field.
Your long-term water demand is 58 gallons per capita per day. What demand management practices do you plan to implement to reduce the per capita water demand (i.e. conduct regular water audits, implement a plumbing retrofit program, employ practices such as rainwater harvesting or reclaimed water)? If these practices are covered elsewhere in your plan, indicate where the practices are discussed here.
Are there other demand management practices you will implement to reduce your future supply needs? Charlotte Water strives to reduce per capita demand through public education, an increasing block rate structure, non-revenue water audits, meter replacement program and a plumbing retrofit program. Additionally, the utility is actively participating in the Partnership for Safe Water Distribution System optimization Program and the non-Revenue Water and Loss Mitigation Program as prescribed in the AWWA M36 Manual. Future per capita demands will be evaluated annually and addressed through various programs or technologies.
What supplies other than the ones listed in future supplies are being considered to meet your future supply needs? Charlotte Water contracted with Black and Veatch to conduct the 2015 Water Distribution System Master Plan. The plan forecasts demands into 2040, and made recommendations on infrastructure and water supplies; particularly for water supplies in 2040 where it is anticipated that CW will exceed 80% demand/supply.
Charlotte Water contracted with Black and Veatch to conduct the 2023 Water Distribution System Master Plan. It includes a 2040 Comprehensive Plan which serves as a framework for future development based on the demand growth of the Charlotte Water Distribution System and existing infrastructure.
How does the water system intend to implement the demand management and supply planning components above?
Additional Information
Has this system participated in regional water supply or water use planning? Yes, Charlotte Water Participated in the Catawba-Wateree Water Management Group (CWWMG). CWWMG serves 4,750 square miles that drain into the Catawba River, providing water to neighbors from Morganton, NC to Camden, SC. This group is currently working with a consultant on a 10-year update to the Water Supply Master Plan (WSMP) now known as the Integrated Water Resources Plan (IWRP).
What major water supply reports or studies were used for planning? The original WSMP performed by the CWWMG concluded that the supply for the entire Catawba River Basin was sustainable through 2025. Results of several initiatives covering long-term planning for water supply, demand and drought management, and climate change are being integrated throughout the IWRP process. A Stakeholder Advisory Team has also been established to evaluate interim plan products and recommend enhancements.
Please describe any other needs or issues regarding your water supply sources, any water system deficiencies or needed improvements (storage, treatment, etc.) or your ability to meet present and future water needs. Include both quantity and quality considerations, as well as financial, technical, managerial, permitting, and compliance issues: These, if any, issues will be identified through CWWMG's IWRP that will be completed in 2025. Charlotte Water contracted with Black and Veatch to conduct the 2023 Water Distribution System Master Plan. The Master Plan study is still ongoing and will provide recommendations on infrastructure and water supplies to improve the water system and forecasts demands and capacity needs into 2040.
The Division of Water Resources (DWR) provides the data contained within this
Local Water Supply Plan (LWSP) as a courtesy and service to our customers.
DWR staff does not field verify data. Neither DWR, nor any other party
involved in the preparation of this LWSP attests that the data is completely
free of errors and omissions. Furthermore, data users are cautioned that
LWSPs labeled PROVISIONAL have yet to be reviewed by DWR staff. Subsequent
review may result in significant revision. Questions regarding the accuracy
or limitations of usage of this data should be directed to the water system
and/or DWR.
|