|
The Division of Water Resources (DWR) provides the data contained within this
Local Water Supply Plan (LWSP) as a courtesy and service to our customers.
DWR staff does not field verify data. Neither DWR, nor any other party
involved in the preparation of this LWSP attests that the data is completely
free of errors and omissions. Furthermore, data users are cautioned that
LWSPs labeled PROVISIONAL have yet to be reviewed by DWR staff. Subsequent
review may result in significant revision. Questions regarding the accuracy
or limitations of usage of this data should be directed to the water system
and/or DWR.
1. System Information
Contact Information
Provisional
| Water System Name: |
Harnett Regional Water System |
|
PWSID: |
03-43-045 |
| Mailing Address: | P. O. Box 1119
Lillington, NC 27546 | Ownership: | County |
| |
| Contact Person: | Allan O'Briant | Title: | Water Plant Supervisor |
| Phone: | 910-893-7575 | Cell/Mobile: | 910-984-6894 |
| |
| Secondary Contact: | Tommy Burns | | Phone: | 910-814-3042 |
| Mailing Address: | P. O. Box 1119
Lillington, NC 27546 | Cell/Mobile: | 910-658-7107 |
Distribution System
| Line Type |
Size Range (Inches) |
Estimated % of lines |
| Asbestos Cement |
6-16 |
0.35 % |
| Ductile Iron |
4-36 |
7.27 % |
| Polyvinyl Chloride |
2-16 |
92.38 % |
Feet of new water lines - used 2025 total miles of water line 1584 - 2024 total miles of water line 1555 = 29 miles new water line.
29 miles x 5,280 ft/mile = 153,120.
Finish Water Storage Capacity does not include a 3.0-million-gallon Clearwell at the water plant, because this is a chlorine contact chamber for Free Chlorine Contact Time (CT) and it's effluent still needs additional treatment.
Installed 2623 new meters and Replaced 113 meters.
Finished Water Storage changed from last year's report b/c WC-Tnk-1 is 250,000 vs the incorrect 300,000 gallons Programs
Hydrants and Blow-offs are worked and flushed by HRW Water Quality Technician Staff with emphasis on dead ends, low usage areas they
have on a monthly, bi-monthly or quarterly flush schedule. Each Fire District also inspects, test and flush hydrants for insurance rating and
maintaining availability in fire suppression emergencies. Hydrant issues are reported by Fire Departments to Harnett Regional Water for
repairs.
Harnett Regional Water completed its system wide meter change over to AMI water meters in 2024. Water Conservation
Interconnections and agreements with surrounding water systems will provide limited supply to our water distribution system due to the large
Harnett Regional Water System coverage area which contains 1584.43 miles of distribution pipelines. This area covers all of Harnett County
except the Town of Dunn. We also supply to Consecutive Water Systems outside of Harnett County, these include Fort Bragg Military Base,
Holly Springs, Fuquay-Varina, Spring Lake, Johnston County & East Moore District. 2. Water Use Information
Service Area
| Sub-Basin(s) | % of Service Population |
|---|
| Cape Fear River (02-3) | 85 % |
| South River (02-4) | 15 % |
|
| County(s) | % of Service Population |
|---|
| Harnett | 80 % |
| Wake | 12 % |
| Cumberland | 8 % |
|
No major changes on Distribution System and would like to keep the System Map submitted last year. Water Use by Type
| Type of Use |
Metered
Connections |
Metered
Average Use (MGD) |
Non-Metered
Connections |
Non-Metered
Estimated Use (MGD) |
| Residential |
47,810 |
6.0924 |
0 |
0.0000 |
| Commercial |
894 |
0.5527 |
0 |
0.0000 |
| Industrial |
13 |
0.0165 |
0 |
0.0000 |
| Institutional |
37 |
0.1033 |
0 |
0.0000 |
How much water was used for system processes (backwash, line cleaning, flushing, etc.)? 1.4704 MGD
How System Process Daily Average is calculated = NPDES metering outfall is a total of the filter backwashing, filter to waste, GAC filter washes
if on-line and Pulsator sludge blowdown decanting that I called the Combined Daily Average = 1.2771 + Plant process daily average = 0.0659 +
Distribution Flushing daily average = 0.0147 + PAC tower makeup water metering daily average = 0.0013 + Polymer carrying water (Process &
Sludge) daily average = 0.0230 + Liquid sludge transfer to North Harnett Regional WWTP for centrifuging daily average = 0.0884.
System Process Daily Average = 1.4704 MGD Water Sales
| Purchaser |
PWSID |
Average
Daily Sold
(MGD) |
Days
Used |
Contract |
Required to
comply with water
use restrictions? |
Pipe Size(s)
(Inches) |
Use
Type |
| MGD |
Expiration |
Recurring |
| Angier |
03-43-015 |
0.7935 |
365 |
1.4400 |
2059 |
Yes |
Yes |
16 |
Regular |
| Bragg Comm./NTA Water System |
50-43-001 |
0.2600 |
365 |
0.8000 |
2053 |
Yes |
Yes |
16 |
Regular |
| Campbell University |
03-43-030 |
0.0762 |
365 |
0.2500 |
2013 |
Yes |
Yes |
20 |
Regular |
| Coats |
03-43-020 |
0.1608 |
365 |
0.3000 |
2017 |
Yes |
Yes |
12 |
Regular |
| Dunn |
03-43-010 |
0.0000 |
0 |
0.2500 |
|
Yes |
No |
12 |
Emergency |
| East Moore Water District |
50-63-011 |
1.6220 |
365 |
3.0000 |
2042 |
Yes |
Yes |
16 |
Regular |
| Fort Bragg Water System |
50-26-019 |
3.2596 |
183 |
4.0000 |
2046 |
Yes |
Yes |
24 |
Regular |
| Fuquay Varina |
03-92-055 |
1.9826 |
365 |
4.0000 |
2032 |
Yes |
Yes |
12&36 |
Regular |
| Holly Springs |
03-92-050 |
3.7521 |
365 |
10.0000 |
2048 |
Yes |
Yes |
36 |
Regular |
| Johnston County |
03-51-070 |
1.1328 |
365 |
2.5000 |
2056 |
Yes |
Yes |
12&12 |
Regular |
| Lillington |
03-43-025 |
0.4891 |
365 |
2.0000 |
2017 |
Yes |
Yes |
16 |
Regular |
| Linden |
03-26-045 |
0.1484 |
365 |
0.2500 |
2031 |
Yes |
Yes |
6 |
Regular |
| Spring Lake |
03-26-020 |
0.3315 |
365 |
0.5000 |
2006 |
Yes |
Yes |
8 |
Regular |
| Woodlake |
03-63-114 |
0.1473 |
365 |
0.1400 |
1999 |
Yes |
Yes |
6 |
Regular |
We supply Fort Bragg on an alternating arrangement with Public Works Commission (PWC), thus the 183 days used. Fort Bragg yearly average
1.6298 x 2 = 3.2596 MGD to represent the daily demand supplied every day that we pump to them. 3. Water Supply Sources
Monthly Withdrawals & Purchases
|
Average Daily
Use (MGD) |
Max Day
Use (MGD) |
|
Average Daily
Use (MGD) |
Max Day
Use (MGD) |
|
Average Daily
Use (MGD) |
Max Day
Use (MGD) |
| Jan |
22.1331 |
26.4261 |
May |
24.3211 |
30.7761 |
Sep |
25.9581 |
29.8361 |
| Feb |
21.1501 |
23.8061 |
Jun |
25.8251 |
32.4161 |
Oct |
24.4561 |
26.7861 |
| Mar |
22.0231 |
24.4561 |
Jul |
25.9811 |
31.1161 |
Nov |
22.1811 |
24.0161 |
| Apr |
23.6801 |
27.0361 |
Aug |
25.4561 |
27.9961 |
Dec |
23.1031 |
26.2561 |
The System Average Daily and System Maximum Day above includes the Dunn average purchase of 0.0261 MGD.
2025 Year WTP Annual Average Production is 23,845,671.23 = 23.846 MGD and WTP Maximum Day was June 25th = 32.390 MGD.
The following Maximum Day Demands are WTP Production numbers.
Highest Annual 3 Day Maximum was 30.610 MGD - June 24th to June 26th.
Highest Annual 5 Day Maximum was 30.134 MGD - June 23rd to June 27th.
2025 Monthly High 3 Day for: May= 28.027 MGD, June = 30.610 MGD, July = 30.383 MGD, August = 27.950 MGD & September = 28.880 MGD 
Surface Water Sources
| Stream |
Reservoir |
Average Daily Withdrawal |
Maximum Day
Withdrawal (MGD) |
Available Raw
Water Supply |
Usable On-Stream
Raw Water Supply
Storage (MG) |
| MGD |
Days Used |
MGD |
* Qualifier |
| Cape Fear River |
Harnett County WTP Reservoir |
23.8460 |
365 |
32.3900 |
42.0000 |
T |
61.0000 |
* Qualifier: C=Contract Amount, SY20=20-year Safe Yield, SY50=50-year Safe Yield, F=20% of 7Q10 or other instream flow requirement, CUA=Capacity Use Area Permit
Surface Water Sources (continued)
| Stream |
Reservoir |
Drainage Area
(sq mi) |
Metered? |
Sub-Basin |
County |
Year
Offline |
Use
Type |
| Cape Fear River |
Harnett County WTP Reservoir |
3,464 |
Yes |
Cape Fear River (02-3) |
Harnett |
|
Regular |
Cape Fear River average daily withdrawal is the 2025 12-month WIMS Annual Local Water Supply Flow Report using Monthly Total Raw MGD
Treated, which is the East & West Pulsator Train flow meters.
2025 annual withdrawal average is 8,703,670,000 / 365 days per year = 23,845,671.23 ~ 23.846 MGD.
2025 annual withdrawal with purchases is 8,703,670,000 + 9,198,000 Dunn = 8,712,868,000 gallons / 365 days per year = 23,870,871.23 =
23.871 MGD
The USGS low flow analysis for the Sanford WTP expansion project annual 7Q10 flow at Lillington River gauge is 288 CFS.
This low flow study is for 2007 to 2022. For 20% for 7Q10 ~ 288 cubic feet per second/1.5472gal per second conversion to MG = 186.1427 MG
and then 20% of 186.1427 MG = 37.228.
Harnett County Regional WTP production rating is 42.000 MGD. Water Purchases From Other Systems
| Seller |
PWSID |
Average
Daily Purchased
(MGD) |
Days
Used |
Contract |
Required to
comply with water
use restrictions? |
Pipe Size(s)
(Inches) |
Use
Type |
| MGD |
Expiration |
Recurring |
| Apex |
03-92-045 |
0.0000 |
0 |
0.0000 |
|
|
Yes |
12 |
Emergency |
| Cary |
03-92-020 |
0.0000 |
0 |
0.0000 |
|
|
Yes |
12 |
Emergency |
| Dunn |
03-43-010 |
0.0261 |
365 |
1.0000 |
2050 |
Yes |
Yes |
16 |
Regular |
| Fuquay Varina |
03-92-055 |
0.0000 |
0 |
1.3000 |
2029 |
Yes |
Yes |
12 |
Emergency |
| Holly Springs |
03-92-050 |
0.0000 |
0 |
1.0000 |
2041 |
Yes |
Yes |
12 |
Emergency |
| Johnston County |
03-51-070 |
0.0000 |
0 |
3.9000 |
|
Yes |
Yes |
12 |
Emergency |
| Raleigh |
03-92-010 |
0.0000 |
0 |
2.0000 |
|
Yes |
Yes |
12 |
Emergency |
| Smithfield |
03-51-010 |
0.0000 |
0 |
0.0000 |
|
Yes |
Yes |
12 |
Emergency |
Dunn Water System 03-43-010 is the only system that we purchase water from daily. Water Treatment Plants
| Plant Name |
Permitted Capacity
(MGD) |
Is Raw Water Metered? |
Is Finished Water Ouput Metered? |
Source |
| Harnett County Regional WTP |
42.0000 |
Yes |
Yes |
Cape Fear River |
Permitted WTP Capacity is 42.000 MGD. 80% WTP Capacity = 33.800 MGD & 90% WTP Capacity = 37.800.
Maximum Day Demand 2025 was 32.4161 MGD on June 25th = HCRWTP (32.390) + Dunn purchase (0.0261)
May - High 3 Day & 5 Day average at WTP = 28.027 19th-21st & 27.380 19th-23rd
June - High 3 Day & 5 Day average at WTP = 30.610 24th-26th & 30.134 23rd-27th
July - High 3 Day & 5 Day average at WTP = 30.383 27th-29th & 29.904 25th-29th
Aug - High 3 Day & 5 Day average at WTP = 27.950 27th-29th & 27.940 25th-29th
Sept - High 3 Day & 5 Day average at WTP = 28.880 3rd-5th & 28.512 1st-5th 4. Wastewater Information
Monthly Discharges
|
Average Daily
Discharge (MGD) |
|
Average Daily
Discharge (MGD) |
|
Average Daily
Discharge (MGD) |
| Jan |
9.0470 |
May |
9.9030 |
Sep |
8.7070 |
| Feb |
10.3240 |
Jun |
10.0480 |
Oct |
8.7300 |
| Mar |
11.3900 |
Jul |
10.5860 |
Nov |
8.7500 |
| Apr |
10.1330 |
Aug |
11.6330 |
Dec |
8.9070 |
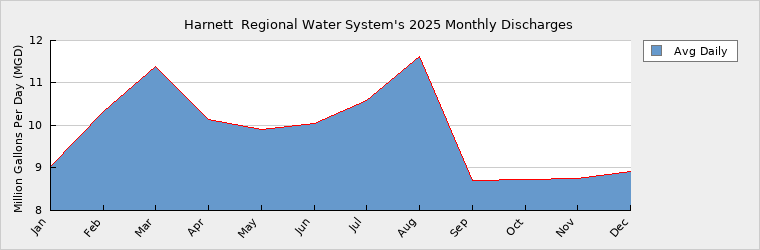
North Harnett Regional Wastewater Treatment Plant (NHRWWTP) is currently expanding from 7.500 MGD to 16.500 MGD. Notice to Proceed issued March 18, 2024. NHRWWTP Construction is well underway with 50% completion.
End of August 2025 to end of December 2025 - little rain so drought conditions. From graph can see this sharp drop in August because of low Inflow and Infiltration (I&I). Wastewater Permits
| Permit Number |
Type |
Permitted Capacity
(MGD) |
Design Capacity
(MGD) |
Average Annual
Daily Discharge
(MGD) |
Maximum Day Discharge
(MGD) |
Receiving Stream |
Receiving Basin |
| NC0007684 |
WTP |
42.0000 |
42.0000 |
1.2770 |
2.3230 |
Cape Fear River |
Cape Fear River (02-3) |
| NC0021636 |
WWTP |
7.5000 |
7.5000 |
4.8560 |
11.4810 |
Cape Fear River |
Cape Fear River (02-3) |
| NC0088366 |
WWTP |
15.0000 |
15.0000 |
4.9900 |
7.7540 |
Lower Little River |
Cape Fear River (02-3) |
Wastewater Interconnections
| Water System |
PWSID |
Type |
Average Daily Amount |
Contract
Maximum (MGD) |
| MGD |
Days Used |
| Angier |
03-43-015 |
Receiving |
0.8761 |
365 |
1.0800 |
| Fort Liberty Water System |
50-26-019 |
Receiving |
3.3922 |
365 |
10.0000 |
| Fuquay-Varina |
03-92-055 |
Receiving |
1.7023 |
365 |
2.6000 |
| Liberty Comm./NTA Water System |
50-43-001 |
Receiving |
0.2872 |
365 |
0.8000 |
| Lillington |
03-43-025 |
Receiving |
0.6417 |
365 |
1.2000 |
13th year receiving Wastewater discharge from Fort Bragg Water System. This flow is treated by the South Harnett Regional WWTP. 5. Planning
Projections
| |
2025 |
2030 |
2040 |
2050 |
2060 |
2070 |
| Year-Round Population |
116,892 |
124,177 |
140,983 |
157,598 |
174,158 |
190,818 |
| Seasonal Population |
0 |
0 |
0 |
0 |
0 |
0 |
| |
| Residential |
6.0924 |
6.8297 |
7.7541 |
8.6679 |
9.5787 |
10.4950 |
| Commercial |
0.5527 |
0.6102 |
0.7438 |
0.9068 |
1.1053 |
1.3474 |
| Industrial |
0.0165 |
0.0173 |
0.0192 |
0.0212 |
0.0234 |
0.0258 |
| Institutional |
0.1033 |
0.1086 |
0.1199 |
0.1325 |
0.1463 |
0.1616 |
| System Process |
1.4704 |
1.5454 |
1.7071 |
1.8857 |
2.0830 |
2.3009 |
| Unaccounted-for |
3.1062 |
3.4404 |
3.9060 |
4.3856 |
4.8850 |
5.4114 |
Population Served = used NC State Office of Budget and Management - Harnett County projects at 80% since do not supply Dunn &
population with their own wells.
Residential - Used 55 gallons per day per capita times the population served number.
Commercial - used 2% growth, Industrial used 1% growth, Institutional used 1% growth & System Process - used 1% growth.
Formula used = Present value (1+%growth) exponent number of years
Residential = (2023) 5.7396 (2024) 6.1699 & (2025) 6.0924
Commercial = (2023) 0.5036 (2024) 0.5638 & (2025) 0.5527
Industrial = (2023) 0.0198 (2024) 0.0189 & (2025) 0.0165
Institutional = (2023) 0.1259 (2024) 0.1347 & (2025) 0.1033
System Process = (2023) 1.2998 (2024) 1.1899 & (2025) 1.4704 Future Water Sales
| Purchaser |
PWSID |
Contract |
Pipe Size(s) (Inches) |
Use Type |
| MGD |
Year Begin |
Year End |
| Angier |
03-43-015 |
1.0000 |
2030 |
2070 |
|
Regular |
Future Supply Sources
| Source Name |
PWSID |
Source Type |
Additional Supply |
Year Online |
Year Offline |
Type |
| Cape Fear River |
00-00-000 |
Surface |
18.0000 |
2030 |
|
Regular |
Preliminary Engineers Report (PER) is being completed for new Water Treatment Plant on the Cape Fear River in Erwin. Demand v/s Percent of Supply
| |
2025 |
2030 |
2040 |
2050 |
2060 |
2070 |
| Surface Water Supply |
42.0000 |
42.0000 |
42.0000 |
42.0000 |
42.0000 |
42.0000 |
| Ground Water Supply |
0.0000 |
0.0000 |
0.0000 |
0.0000 |
0.0000 |
0.0000 |
| Purchases |
1.0000 |
1.0000 |
1.0000 |
1.0000 |
1.0000 |
1.0000 |
| Future Supplies |
18.0000 |
18.0000 |
18.0000 |
18.0000 |
18.0000 |
| Total Available Supply (MGD) |
43.0000 |
61.0000 |
61.0000 |
61.0000 |
61.0000 |
61.0000 |
| Service Area Demand |
11.3415 |
12.5516 |
14.2501 |
15.9997 |
17.8217 |
19.7421 |
| Sales |
12.5306 |
29.1873 |
29.1873 |
29.1873 |
29.1873 |
29.1873 |
| Future Sales |
1.0000 |
1.0000 |
1.0000 |
1.0000 |
0.0000 |
| Total Demand (MGD) |
23.8721 |
42.7389 |
44.4374 |
46.1870 |
48.0090 |
48.9294 |
| Demand as Percent of Supply |
56% |
70% |
73% |
76% |
79% |
80% |

The purpose of the above chart is to show a general indication of how the long-term per capita water demand changes over time. The per capita water demand may actually be different than indicated due to seasonal populations and the accuracy of data submitted. Water systems that have calculated long-term per capita water demand based on a methodology that produces different results may submit their information in the notes field.
Your long-term water demand is 52 gallons per capita per day. What demand management practices do you plan to implement to reduce the per capita water demand (i.e. conduct regular water audits, implement a plumbing retrofit program, employ practices such as rainwater harvesting or reclaimed water)? If these practices are covered elsewhere in your plan, indicate where the practices are discussed here.
Harnett Regional Water (HRW) has completed its conversion to Automatic Meter Reading (AMR) system for the distribution customers. This
system has capability to alert us of customer high demands - possible customer side meter leaks, running toilet etc. Customers can sign up to
use the AMR system to get notification of water usage to monitor their household usage.
Are there other demand management practices you will implement to reduce your future supply needs? Future conservation could be the implementation of an active Water Conservation Public Education Program.
What supplies other than the ones listed in future supplies are being considered to meet your future supply needs? A possibility for the way in the future to supply the southern and Fort Bragg part of the Harnett Regional Water grid is to build a Water
Treatment Facility on the Upper or Lower Little River.
How does the water system intend to implement the demand management and supply planning components above? Harnett Regional Water is currently updating its Hydraulic Model (Hazen & Sawyer) to facilitate and use for future distribution system
upgrades and planning.
Additional Information
Has this system participated in regional water supply or water use planning? Yes, Harnett Regional Water is a member of the Triangle Water Supply Partnership.
What major water supply reports or studies were used for planning? Have used the previous Hydraulic Model study to make improvements in the distributions system - primarily the easily implemented and low
cost improvements were incorporated. Currently updating the distribution hydraulic model.
Please describe any other needs or issues regarding your water supply sources, any water system deficiencies or needed improvements (storage, treatment, etc.) or your ability to meet present and future water needs. Include both quantity and quality considerations, as well as financial, technical, managerial, permitting, and compliance issues: Have plans for 1-million-gallon tank at Hwy 401 & Christian Light Road on the 36-inch line that pumps from Water Plant to the 5.3 MG Wake
County Ground Storage Tank that supply Holly Springs, Fuquay-Varina and feeds the Northwest Booster Pump Station. This new tank will have
a new pump station also.
Northwest District has only one tank in a fast-growing area of county and Northwest Booster Station 1 has difficulty in summer or periods
when filling after big leaks and must refill tank from low levels.
The Division of Water Resources (DWR) provides the data contained within this
Local Water Supply Plan (LWSP) as a courtesy and service to our customers.
DWR staff does not field verify data. Neither DWR, nor any other party
involved in the preparation of this LWSP attests that the data is completely
free of errors and omissions. Furthermore, data users are cautioned that
LWSPs labeled PROVISIONAL have yet to be reviewed by DWR staff. Subsequent
review may result in significant revision. Questions regarding the accuracy
or limitations of usage of this data should be directed to the water system
and/or DWR.
|