|
The Division of Water Resources (DWR) provides the data contained within this
Local Water Supply Plan (LWSP) as a courtesy and service to our customers.
DWR staff does not field verify data. Neither DWR, nor any other party
involved in the preparation of this LWSP attests that the data is completely
free of errors and omissions. Furthermore, data users are cautioned that
LWSPs labeled PROVISIONAL have yet to be reviewed by DWR staff. Subsequent
review may result in significant revision. Questions regarding the accuracy
or limitations of usage of this data should be directed to the water system
and/or DWR.
1. System Information
Contact Information
Complete
| Water System Name: |
Cove City |
|
PWSID: |
04-25-045 |
| Mailing Address: | PO Box 8
Cove City, NC 28523-0008 | Ownership: | Municipality |
| |
| Contact Person: | Lydia Monette | Title: | Clerk |
| Phone: | 252-633-1595 | Cell/Mobile: | -- |
| |
| Secondary Contact: | Mike Houston | | Phone: | 919-812-6088 |
| Mailing Address: |
, NC | Cell/Mobile: | -- |
Distribution System
| Line Type |
Size Range (Inches) |
Estimated % of lines |
| Polyvinyl Chloride |
2-8 |
100.00 % |
Due to older meters in the system, we feel that our unaccounted-for water percentage may be lower than it actually is. Cove City is currently awaiting approval of multiple funding sources from the state / federal government. We intend to make water improvements upon receiving these funds, however no particular allocations have been made at this time, but we anticipate new water meters will be a main priority.
2025 Update:
An estimated 15 new meters have been installed, and we anticipate this will help us reduce our unaccounted-for water amounts moving forward. Programs
Employees do daily visual inspections of the system and read the Town's main meter daily. The Town also utilizes NCRWA on an as needed basis. Water Conservation
2. Water Use Information
Service Area
| Sub-Basin(s) | % of Service Population |
|---|
| Neuse River (10-1) | 100 % |
|
| County(s) | % of Service Population |
|---|
| Craven | 100 % |
|
Water Use by Type
| Type of Use |
Metered
Connections |
Metered
Average Use (MGD) |
Non-Metered
Connections |
Non-Metered
Estimated Use (MGD) |
| Residential |
226 |
0.0211 |
0 |
0.0000 |
| Commercial |
14 |
0.0021 |
0 |
0.0000 |
| Industrial |
0 |
0.0000 |
0 |
0.0000 |
| Institutional |
10 |
0.0004 |
0 |
0.0000 |
How much water was used for system processes (backwash, line cleaning, flushing, etc.)? 0.0063 MGD
Explanation of System Process Increase from 2024 to 2025:
During the months of January 25' and February 25', the Town performed extensive flushing due to our ongoing AIA project, which including flushing of sewer collection lines for inspection purposes. During the month of August 25', the Town increased flushing dramatically to help aid with chlorine residuals throughout the entire distribution system. 3. Water Supply Sources
Monthly Withdrawals & Purchases
|
Average Daily
Use (MGD) |
Max Day
Use (MGD) |
|
Average Daily
Use (MGD) |
Max Day
Use (MGD) |
|
Average Daily
Use (MGD) |
Max Day
Use (MGD) |
| Jan |
0.0636 |
|
May |
0.0088 |
|
Sep |
0.0214 |
|
| Feb |
0.0631 |
|
Jun |
0.0137 |
|
Oct |
0.0227 |
|
| Mar |
0.0130 |
|
Jul |
0.0171 |
|
Nov |
0.0271 |
|
| Apr |
0.0277 |
|
Aug |
0.0990 |
|
Dec |
0.0288 |
|
During the months of January and February, the Town performed extensive flushing due to our ongoing AIA project, which including flushing of sewer collection lines for inspection purposes. During the month of August, the Town increased flushing dramatically to help aid with chlorine residuals throughout the entire distribution system. 
Water Purchases From Other Systems
| Seller |
PWSID |
Average
Daily Purchased
(MGD) |
Days
Used |
Contract |
Required to
comply with water
use restrictions? |
Pipe Size(s)
(Inches) |
Use
Type |
| MGD |
Expiration |
Recurring |
| Craven County |
04-25-055 |
0.0338 |
365 |
0.2500 |
2025 |
Yes |
Yes |
6 |
Regular |
| New Bern |
04-25-010 |
0.0000 |
0 |
0.0980 |
2030 |
Yes |
Yes |
6 |
Emergency |
During the months of January and February, the Town performed extensive flushing due to our ongoing AIA project, which including flushing of sewer collection lines for inspection purposes. During the month of August, the Town increased flushing dramatically to help aid with chlorine residuals throughout the entire distribution system. 4. Wastewater Information
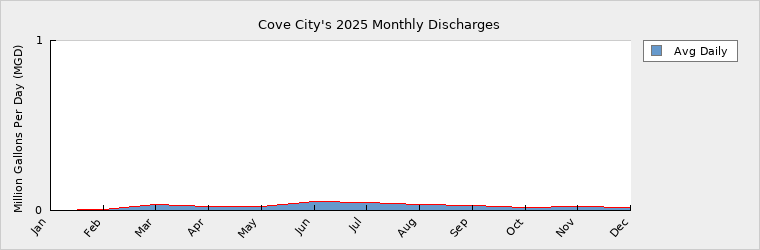
Monthly Discharges
|
Average Daily
Discharge (MGD) |
|
Average Daily
Discharge (MGD) |
|
Average Daily
Discharge (MGD) |
| Jan |
0.0023 |
May |
0.0254 |
Sep |
0.0295 |
| Feb |
0.0037 |
Jun |
0.0513 |
Oct |
0.0193 |
| Mar |
0.0331 |
Jul |
0.0454 |
Nov |
0.0230 |
| Apr |
0.0232 |
Aug |
0.0327 |
Dec |
0.0185 |
Wastewater Interconnections
| Water System |
PWSID |
Type |
Average Daily Amount |
Contract
Maximum (MGD) |
| MGD |
Days Used |
| City of Kinston |
04-54-010 |
Discharging |
0.0256 |
365 |
0.1000 |
5. Planning
Projections
| |
2025 |
2030 |
2040 |
2050 |
2060 |
2070 |
| Year-Round Population |
440 |
440 |
440 |
440 |
440 |
440 |
| Seasonal Population |
0 |
0 |
0 |
0 |
0 |
0 |
| |
| Residential |
0.0211 |
0.0211 |
0.0211 |
0.0211 |
0.0211 |
0.0211 |
| Commercial |
0.0021 |
0.0021 |
0.0021 |
0.0021 |
0.0021 |
0.0021 |
| Industrial |
0.0000 |
0.0000 |
0.0000 |
0.0000 |
0.0000 |
0.0000 |
| Institutional |
0.0004 |
0.0004 |
0.0004 |
0.0004 |
0.0004 |
0.0004 |
| System Process |
0.0063 |
0.0005 |
0.0005 |
0.0005 |
0.0005 |
0.0005 |
| Unaccounted-for |
0.0039 |
0.0031 |
0.0031 |
0.0031 |
0.0031 |
0.0031 |
We anticipate our system process water totals to return to "normal" operational levels moving forward, now that the collection system project has come to an end. Demand v/s Percent of Supply
| |
2025 |
2030 |
2040 |
2050 |
2060 |
2070 |
| Surface Water Supply |
0.0000 |
0.0000 |
0.0000 |
0.0000 |
0.0000 |
0.0000 |
| Ground Water Supply |
0.0000 |
0.0000 |
0.0000 |
0.0000 |
0.0000 |
0.0000 |
| Purchases |
0.2500 |
0.2500 |
0.2500 |
0.2500 |
0.2500 |
0.2500 |
| Future Supplies |
0.0000 |
0.0000 |
0.0000 |
0.0000 |
0.0000 |
| Total Available Supply (MGD) |
0.2500 |
0.2500 |
0.2500 |
0.2500 |
0.2500 |
0.2500 |
| Service Area Demand |
0.0338 |
0.0272 |
0.0272 |
0.0272 |
0.0272 |
0.0272 |
| Sales |
0.0000 |
0.0000 |
0.0000 |
0.0000 |
0.0000 |
0.0000 |
| Future Sales |
0.0000 |
0.0000 |
0.0000 |
0.0000 |
0.0000 |
| Total Demand (MGD) |
0.0338 |
0.0272 |
0.0272 |
0.0272 |
0.0272 |
0.0272 |
| Demand as Percent of Supply |
14% |
11% |
11% |
11% |
11% |
11% |

The purpose of the above chart is to show a general indication of how the long-term per capita water demand changes over time. The per capita water demand may actually be different than indicated due to seasonal populations and the accuracy of data submitted. Water systems that have calculated long-term per capita water demand based on a methodology that produces different results may submit their information in the notes field.
Your long-term water demand is 48 gallons per capita per day. What demand management practices do you plan to implement to reduce the per capita water demand (i.e. conduct regular water audits, implement a plumbing retrofit program, employ practices such as rainwater harvesting or reclaimed water)? If these practices are covered elsewhere in your plan, indicate where the practices are discussed here.
No Changes
Are there other demand management practices you will implement to reduce your future supply needs? No Changes
What supplies other than the ones listed in future supplies are being considered to meet your future supply needs? No Changes
How does the water system intend to implement the demand management and supply planning components above? No Changes
Additional Information
Has this system participated in regional water supply or water use planning? Yes, CCPCUA
What major water supply reports or studies were used for planning? N/A
Please describe any other needs or issues regarding your water supply sources, any water system deficiencies or needed improvements (storage, treatment, etc.) or your ability to meet present and future water needs. Include both quantity and quality considerations, as well as financial, technical, managerial, permitting, and compliance issues: Radio read meters, water and sewer rehabilitation.
The Division of Water Resources (DWR) provides the data contained within this
Local Water Supply Plan (LWSP) as a courtesy and service to our customers.
DWR staff does not field verify data. Neither DWR, nor any other party
involved in the preparation of this LWSP attests that the data is completely
free of errors and omissions. Furthermore, data users are cautioned that
LWSPs labeled PROVISIONAL have yet to be reviewed by DWR staff. Subsequent
review may result in significant revision. Questions regarding the accuracy
or limitations of usage of this data should be directed to the water system
and/or DWR.
|