|
The Division of Water Resources (DWR) provides the data contained within this
Local Water Supply Plan (LWSP) as a courtesy and service to our customers.
DWR staff does not field verify data. Neither DWR, nor any other party
involved in the preparation of this LWSP attests that the data is completely
free of errors and omissions. Furthermore, data users are cautioned that
LWSPs labeled PROVISIONAL have yet to be reviewed by DWR staff. Subsequent
review may result in significant revision. Questions regarding the accuracy
or limitations of usage of this data should be directed to the water system
and/or DWR.
1. System Information
Contact Information
Provisional
| Water System Name: |
Banner Elk |
|
PWSID: |
01-06-015 |
| Mailing Address: | P.O. 2049
Banner Elk, NC 28604 | Ownership: | Municipality |
| |
| Contact Person: | Justin Hodges | Title: | Public Service Director |
| Phone: | 828-898-5398 | Cell/Mobile: | -- |
Distribution System
| Line Type |
Size Range (Inches) |
Estimated % of lines |
| Asbestos Cement |
6-8 |
50.00 % |
| Ductile Iron |
6-8 |
5.00 % |
| Galvanized Iron |
3/4-2 |
5.00 % |
| Polyvinyl Chloride |
2-8 |
40.00 % |
During Hurricane Helene several water mains located near creeks were washed out. The necessary repairs were made and proper procedures performed to get the lines back into service and drinking water restored to the Town. Some valves are still closed, and water is being rerouted in certain areas, there is plans to install lines back where the existing lines were pre-helene. The entire system lost pressure for several days. Programs
Water Conservation
2. Water Use Information
Service Area
| Sub-Basin(s) | % of Service Population |
|---|
| Watauga River (16-1) | 100 % |
|
| County(s) | % of Service Population |
|---|
| Avery | 100 % |
|
Population is based upon the most recent US census population estimate of 1134 plus outside water Accounts (6 accounts @ 2.5 persons per account =15) 1149+15=1164. Seasonal population based on 50% of accounts being seasonal 320 @ 2.5 persons per account = 800 additional, 1164=800=1964. Water Use by Type
| Type of Use |
Metered
Connections |
Metered
Average Use (MGD) |
Non-Metered
Connections |
Non-Metered
Estimated Use (MGD) |
| Residential |
642 |
0.0475 |
0 |
0.0000 |
| Commercial |
88 |
0.0240 |
0 |
0.0000 |
| Industrial |
0 |
0.0000 |
0 |
0.0000 |
| Institutional |
17 |
0.0423 |
0 |
0.0000 |
How much water was used for system processes (backwash, line cleaning, flushing, etc.)? 0.0010 MGD
3. Water Supply Sources
Monthly Withdrawals & Purchases
|
Average Daily
Use (MGD) |
Max Day
Use (MGD) |
|
Average Daily
Use (MGD) |
Max Day
Use (MGD) |
|
Average Daily
Use (MGD) |
Max Day
Use (MGD) |
| Jan |
0.2656 |
|
May |
0.1697 |
|
Sep |
0.1708 |
|
| Feb |
0.2112 |
|
Jun |
0.1652 |
|
Oct |
0.0829 |
|
| Mar |
0.1669 |
|
Jul |
0.1948 |
|
Nov |
0.1183 |
|
| Apr |
0.1685 |
|
Aug |
0.2656 |
|
Dec |
0.1187 |
|
From Sept.-Dec our Well Pump data was skewed by Hurricane Helene. 
Ground Water Sources
| Name or Number |
Average Daily Withdrawal (MGD) |
Max Day Withdrawal (MGD) |
12-Hour Supply
(MGD) |
CUA Reduction |
Year Offline |
Use Type |
| MGD |
Days Used |
| Well 1 |
0.0327 |
269 |
|
0.0720 |
|
|
Regular |
| Well 2 |
0.0394 |
343 |
|
0.0600 |
|
|
Regular |
| Well 3 |
0.0471 |
351 |
|
0.1440 |
|
|
Regular |
| Well 5 |
0.0501 |
347 |
|
0.0900 |
|
|
Regular |
Ground Water Sources (continued)
| Name or Number |
Well Depth (Feet) |
Casing Depth
(Feet) |
Screen Depth (Feet) |
Well Diameter (Inches) |
Pump Intake Depth (Feet) |
Metered? |
| Top |
Bottom |
| Well 1 |
175 |
0 |
0 |
0 |
6 |
150 |
Yes |
| Well 2 |
170 |
0 |
0 |
0 |
6 |
147 |
Yes |
| Well 3 |
175 |
0 |
0 |
0 |
6 |
147 |
Yes |
| Well 5 |
650 |
210 |
0 |
0 |
6 |
630 |
Yes |
4. Wastewater Information
Monthly Discharges
|
Average Daily
Discharge (MGD) |
|
Average Daily
Discharge (MGD) |
|
Average Daily
Discharge (MGD) |
| Jan |
0.4168 |
May |
0.2887 |
Sep |
0.2288 |
| Feb |
0.3431 |
Jun |
0.1877 |
Oct |
0.0810 |
| Mar |
0.3297 |
Jul |
0.1903 |
Nov |
0.2103 |
| Apr |
0.3307 |
Aug |
0.1934 |
Dec |
0.3223 |
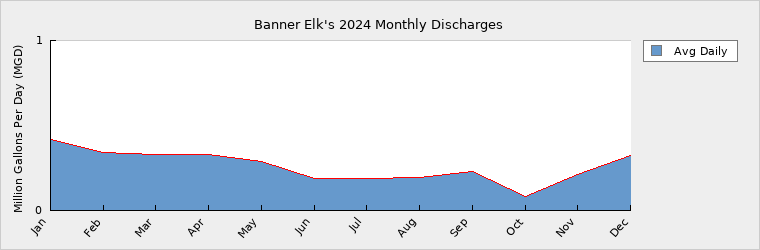
We are currently working with Mcgill Engineering to have an additional clarifier added to the plant, we also are looking at upgrades to UV system and barscreen. Wastewater Permits
| Permit Number |
Type |
Permitted Capacity
(MGD) |
Design Capacity
(MGD) |
Average Annual
Daily Discharge
(MGD) |
Maximum Day Discharge
(MGD) |
Receiving Stream |
Receiving Basin |
| NC0032115 |
WWTP |
0.6000 |
0.6000 |
0.2602 |
0.9000 |
Elk River |
Watauga River (16-1) |
5. Planning
Projections
| |
2024 |
2030 |
2040 |
2050 |
2060 |
2070 |
| Year-Round Population |
1,164 |
1,174 |
1,184 |
1,194 |
1,204 |
1,214 |
| Seasonal Population |
1,964 |
1,974 |
1,984 |
1,994 |
2,004 |
2,014 |
| |
| Residential |
0.0475 |
0.0512 |
0.0522 |
0.0532 |
0.0542 |
0.0552 |
| Commercial |
0.0240 |
0.0349 |
0.0359 |
0.0369 |
0.0379 |
0.0389 |
| Industrial |
0.0000 |
0.0000 |
0.0000 |
0.0000 |
0.0000 |
0.0000 |
| Institutional |
0.0423 |
0.0426 |
0.0429 |
0.0432 |
0.0435 |
0.0438 |
| System Process |
0.0010 |
0.0001 |
0.0001 |
0.0001 |
0.0001 |
0.0001 |
| Unaccounted-for |
0.0388 |
0.0435 |
0.0443 |
0.0451 |
0.0459 |
0.0466 |
Demand v/s Percent of Supply
| |
2024 |
2030 |
2040 |
2050 |
2060 |
2070 |
| Surface Water Supply |
0.0000 |
0.0000 |
0.0000 |
0.0000 |
0.0000 |
0.0000 |
| Ground Water Supply |
0.3660 |
0.3660 |
0.3660 |
0.3660 |
0.3660 |
0.3660 |
| Purchases |
0.0000 |
0.0000 |
0.0000 |
0.0000 |
0.0000 |
0.0000 |
| Future Supplies |
0.0000 |
0.0000 |
0.0000 |
0.0000 |
0.0000 |
| Total Available Supply (MGD) |
0.3660 |
0.3660 |
0.3660 |
0.3660 |
0.3660 |
0.3660 |
| Service Area Demand |
0.1536 |
0.1723 |
0.1754 |
0.1785 |
0.1816 |
0.1846 |
| Sales |
0.0000 |
0.0000 |
0.0000 |
0.0000 |
0.0000 |
0.0000 |
| Future Sales |
0.0000 |
0.0000 |
0.0000 |
0.0000 |
0.0000 |
| Total Demand (MGD) |
0.1536 |
0.1723 |
0.1754 |
0.1785 |
0.1816 |
0.1846 |
| Demand as Percent of Supply |
42% |
47% |
48% |
49% |
50% |
50% |

The purpose of the above chart is to show a general indication of how the long-term per capita water demand changes over time. The per capita water demand may actually be different than indicated due to seasonal populations and the accuracy of data submitted. Water systems that have calculated long-term per capita water demand based on a methodology that produces different results may submit their information in the notes field.
Your long-term water demand is 41 gallons per capita per day. What demand management practices do you plan to implement to reduce the per capita water demand (i.e. conduct regular water audits, implement a plumbing retrofit program, employ practices such as rainwater harvesting or reclaimed water)? If these practices are covered elsewhere in your plan, indicate where the practices are discussed here.
No Changes
Are there other demand management practices you will implement to reduce your future supply needs? The Twon continues to work with its engineers to prioritize areas in the water system that need attention. Also, the Town public service staff have been trained with new leak detection equipment and have already utilized this equipment to reduce water loss in the system.
What supplies other than the ones listed in future supplies are being considered to meet your future supply needs? A new well is still in discussion and has been listed in the CIP and is being discussed internally and with the Town's engineers.
How does the water system intend to implement the demand management and supply planning components above? The Town has worked with McGill and Associates on the system development fee, rate structure, and CIP.
Additional Information
Has this system participated in regional water supply or water use planning? No
What major water supply reports or studies were used for planning?
Please describe any other needs or issues regarding your water supply sources, any water system deficiencies or needed improvements (storage, treatment, etc.) or your ability to meet present and future water needs. Include both quantity and quality considerations, as well as financial, technical, managerial, permitting, and compliance issues: The Town has historically had high water loss and Town staff have worked to locate leaks and problem areas to make the necessary repairs in the water system and will continue to do so to reduce water loss. A new well is being strongly considered to give the Town confidence in its supply/demand ratio for future development. Also, another storage tank has been mentioned to give added protection and redundancy to the water system.
The Division of Water Resources (DWR) provides the data contained within this
Local Water Supply Plan (LWSP) as a courtesy and service to our customers.
DWR staff does not field verify data. Neither DWR, nor any other party
involved in the preparation of this LWSP attests that the data is completely
free of errors and omissions. Furthermore, data users are cautioned that
LWSPs labeled PROVISIONAL have yet to be reviewed by DWR staff. Subsequent
review may result in significant revision. Questions regarding the accuracy
or limitations of usage of this data should be directed to the water system
and/or DWR.
|