|
The Division of Water Resources (DWR) provides the data contained within this
Local Water Supply Plan (LWSP) as a courtesy and service to our customers.
DWR staff does not field verify data. Neither DWR, nor any other party
involved in the preparation of this LWSP attests that the data is completely
free of errors and omissions. Furthermore, data users are cautioned that
LWSPs labeled PROVISIONAL have yet to be reviewed by DWR staff. Subsequent
review may result in significant revision. Questions regarding the accuracy
or limitations of usage of this data should be directed to the water system
and/or DWR.
1. System Information
Contact Information
Complete
| Water System Name: |
Asheville |
|
PWSID: |
01-11-010 |
| Mailing Address: | PO Box 7148
Asheville, NC 28802 | Ownership: | Municipality |
| |
| Contact Person: | Brenna Cook | Title: | Compliance Manager |
| Phone: | 828-259-5962 | Cell/Mobile: | -- |
| |
| Secondary Contact: | Bill Hart | | Phone: | 828-259-5957 |
| Mailing Address: | PO Box 7148
Asheville, NC 28802 | Cell/Mobile: | -- |
Distribution System
| Line Type |
Size Range (Inches) |
Estimated % of lines |
| Asbestos Cement |
4-8 |
0.50 % |
| Cast Iron |
6-24 |
47.00 % |
| Ductile Iron |
6-24 |
32.00 % |
| Galvanized Iron |
2-4 |
16.00 % |
| Other |
14-36 |
2.00 % |
| Polyvinyl Chloride |
2-12 |
2.50 % |
Estimated total miles of distribution lines is based on current GIS data. There are 55 pressure zones in the water system, ranging from 20 to 643 psi with an average pressure of 180-200psi. Programs
There is a valve crew of 5 employees that exercise, maintain and schedule shutdowns through engineering as needed. GPS information is collected to ensure GIS data integrity is maintained while work is conducted. Leak survey consists of a two person team who conduct proactive system-wide leak detection daily. They utilize Gutterman correlators, Perma Net SU units, and DX and L mics as needed. The Cross-Connection Control team consists of two Backflow Inspectors and one Supervisor. Water Conservation
Uniform rate structure is used for single-family residential, multi-family residential, and wholesale/bulk customers. Decreasing block structure is used for commercial and manufacturing customers. 2. Water Use Information
Service Area
| Sub-Basin(s) | % of Service Population |
|---|
| French Broad River (05-2) | 100 % |
|
| County(s) | % of Service Population |
|---|
| Buncombe | 98 % |
| Henderson | 2 % |
|
We do not have a seasonal population. Year round population increased due to state records in 2021 when we received our permit to operate and water system. A GIS Map was sent to Vardry Austin with NCDEQ on February 3, 2022 per his request. Water Use by Type
| Type of Use |
Metered
Connections |
Metered
Average Use (MGD) |
Non-Metered
Connections |
Non-Metered
Estimated Use (MGD) |
| Residential |
55,150 |
8.6905 |
0 |
0.0000 |
| Commercial |
4,050 |
3.9284 |
0 |
0.0000 |
| Industrial |
11 |
0.6375 |
0 |
0.0000 |
| Institutional |
619 |
1.7624 |
0 |
0.0000 |
How much water was used for system processes (backwash, line cleaning, flushing, etc.)? 0.5490 MGD
Residential included Single-Family, Permanent Extension (Hardship), and irrigation. Industrial includes Manufacturing rate class. Institutional includes Churches, Hospitals, Medical, Schools, Fire Departments and Wholesale.
The Water Usage for System Processes is higher than last few years because we clarified we needed to add distribution system flushing to the total. Water Sales
| Purchaser |
PWSID |
Average
Daily Sold
(MGD) |
Days
Used |
Contract |
Required to
comply with water
use restrictions? |
Pipe Size(s)
(Inches) |
Use
Type |
| MGD |
Expiration |
Recurring |
| City of Hendersonville |
01-45-010 |
0.0000 |
0 |
0.0000 |
2026 |
No |
Yes |
14 |
Emergency |
| Town of Biltmore Forest |
01-11-030 |
0.1419 |
365 |
0.3500 |
2022 |
Yes |
Yes |
6, 8 |
Regular |
| Town of Black Mountain |
01-11-020 |
0.4168 |
365 |
0.4400 |
2022 |
Yes |
Yes |
8 |
Regular |
| Town of Weaverville |
01-11-025 |
0.0000 |
0 |
0.0000 |
|
Yes |
No |
8 |
Emergency |
| Woodfin Sanitary Water & Sewer District |
01-11-015 |
0.3230 |
365 |
1.0000 |
2026 |
Yes |
Yes |
8 |
Regular |
We have an annual contract with the Town of Black Mountain. The contract amount is 0.44 MGD. 3. Water Supply Sources
Monthly Withdrawals & Purchases
|
Average Daily
Use (MGD) |
Max Day
Use (MGD) |
|
Average Daily
Use (MGD) |
Max Day
Use (MGD) |
|
Average Daily
Use (MGD) |
Max Day
Use (MGD) |
| Jan |
21.0800 |
22.2900 |
May |
22.3500 |
24.2700 |
Sep |
23.0500 |
24.7600 |
| Feb |
20.7400 |
21.8400 |
Jun |
23.1200 |
26.0400 |
Oct |
22.8200 |
24.3900 |
| Mar |
20.6900 |
21.7500 |
Jul |
23.0500 |
25.2900 |
Nov |
22.1900 |
23.4000 |
| Apr |
21.3500 |
22.8100 |
Aug |
23.1600 |
25.4200 |
Dec |
22.1600 |
23.1100 |

Surface Water Sources
| Stream |
Reservoir |
Average Daily Withdrawal |
Maximum Day
Withdrawal (MGD) |
Available Raw
Water Supply |
Usable On-Stream
Raw Water Supply
Storage (MG) |
| MGD |
Days Used |
MGD |
* Qualifier |
| Bee Tree Creek |
Bee Tree |
2.8500 |
298 |
3.6000 |
3.3000 |
T |
512.0000 |
| Mills and French Broad Rivers |
N/A |
3.5900 |
200 |
4.6600 |
47.6000 |
F |
0.0000 |
| North Fork of Swannanoa |
Burnett |
17.5100 |
365 |
20.8000 |
19.7000 |
T |
5,600.0000 |
* Qualifier: C=Contract Amount, SY20=20-year Safe Yield, SY50=50-year Safe Yield, F=20% of 7Q10 or other instream flow requirement, CUA=Capacity Use Area Permit
Surface Water Sources (continued)
| Stream |
Reservoir |
Drainage Area
(sq mi) |
Metered? |
Sub-Basin |
County |
Year
Offline |
Use
Type |
| Bee Tree Creek |
Bee Tree |
8 |
Yes |
French Broad River (05-2) |
Buncombe |
|
Regular |
| Mills and French Broad Rivers |
N/A |
74 |
Yes |
French Broad River (05-2) |
Henderson |
|
Regular |
| North Fork of Swannanoa |
Burnett |
25 |
Yes |
French Broad River (05-2) |
Buncombe |
|
Regular |
The North Fork (Burnette) Reservoir Dam Improvements environmental permitting requires a minimum flow depending on the level of the lake. The Available Water Supply was incorrectly reported in the past for the North Fork of the Swannanoa, so the change from 31.0 to 19.7 MGD is due to the release requirements along with the incorrect number being reported. In 2020, the number should have been 21.5 for the North Fork of the Swannanoa. The Mills River Water Treatment Plant has an off-stream raw water storage capacity of 15 million gallons.
The actual Qualifier for the Available Raw Water Supply is SY-80. Was told by NC DEQ representative to leave the qualifier as is since we did not have that specific selection.
The 2021 plan was updated with available supply for the Mills and French Broad Rivers based on 7Q10 calculations performed by CDM-Smith. Water Purchases From Other Systems
| Seller |
PWSID |
Average
Daily Purchased
(MGD) |
Days
Used |
Contract |
Required to
comply with water
use restrictions? |
Pipe Size(s)
(Inches) |
Use
Type |
| MGD |
Expiration |
Recurring |
| City of Hendersonville |
01-45-010 |
0.0000 |
0 |
0.0000 |
|
Yes |
Yes |
24 |
Emergency |
| Town of Black Mountain |
01-11-020 |
0.0000 |
0 |
0.0000 |
|
Yes |
Yes |
6 |
Emergency |
| Town of Weaverville |
01-11-025 |
0.0000 |
0 |
0.0000 |
|
Yes |
Yes |
8 |
Emergency |
| Woodfin Sanitary Water & Sewer District |
01-11-015 |
0.0000 |
0 |
0.0000 |
|
Yes |
Yes |
8 |
Emergency |
Water Treatment Plants
| Plant Name |
Permitted Capacity
(MGD) |
Is Raw Water Metered? |
Is Finished Water Ouput Metered? |
Source |
| Mills River WTP |
7.5000 |
Yes |
Yes |
Mills and French Broad Rivers |
| North Fork WTP |
31.5000 |
Yes |
Yes |
Burnett Reservoir |
| William DeBruhl WTP |
5.0000 |
Yes |
Yes |
Bee Tree Reservoir |
4. Wastewater Information
Monthly Discharges
|
Average Daily
Discharge (MGD) |
|
Average Daily
Discharge (MGD) |
|
Average Daily
Discharge (MGD) |
| Jan |
23.1100 |
May |
25.4100 |
Sep |
21.0100 |
| Feb |
24.9900 |
Jun |
22.7300 |
Oct |
23.5700 |
| Mar |
30.0100 |
Jul |
21.0500 |
Nov |
19.7100 |
| Apr |
25.3300 |
Aug |
24.3900 |
Dec |
19.2700 |
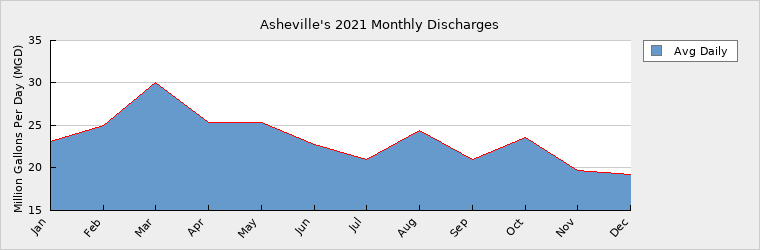
The Average Daily Discharge information includes both the Buncombe County Metropolitan Sewerage District (MSD), permit # NC0024911 and the three City of Asheville Water Treatment Facilities discharge permits. MSD does not plan to expand their treatment facility, but City of Asheville has plans to build a treatment system for their sludge removal processes for all three Water Treatment Facilities, hopefully in the next 10 years.
The number of sewer connections reported is just for the City of Asheville and not all MSD connections since they serve other water utilities in Buncombe County.
The number for service connections with a septic system was determined by searching for accounts that did not have sewer or irrigation connections. Wastewater Permits
| Permit Number |
Type |
Permitted Capacity
(MGD) |
Design Capacity
(MGD) |
Average Annual
Daily Discharge
(MGD) |
Maximum Day Discharge
(MGD) |
Receiving Stream |
Receiving Basin |
| NC0035807 |
WTP |
4.7600 |
4.7600 |
0.2480 |
0.6980 |
North Fork of Swannanoa |
French Broad River (05-2) |
| NC0056961 |
WTP |
0.8000 |
0.8000 |
0.0390 |
0.1420 |
Bee Tree Creek |
French Broad River (05-2) |
| NCG590034 |
WTP |
0.0640 |
0.0640 |
0.0473 |
0.4060 |
French Broad River |
French Broad River (05-2) |
Mills River discharge permit was switched to a general permit (NCG590034) starting Feb 1, 2021. Deleted the old permit from report (NC0085511). Wastewater Interconnections
| Water System |
PWSID |
Type |
Average Daily Amount |
Contract
Maximum (MGD) |
| MGD |
Days Used |
| Metropolitan Sewerage District |
00-00-000 |
Discharging |
22.6900 |
365 |
0.0000 |
5. Planning
Projections
| |
2021 |
2030 |
2040 |
2050 |
2060 |
2070 |
| Year-Round Population |
156,034 |
135,357 |
149,518 |
165,161 |
182,441 |
201,528 |
| Seasonal Population |
0 |
0 |
0 |
0 |
0 |
0 |
| |
| Residential |
8.6905 |
9.0530 |
10.0000 |
11.0460 |
12.2020 |
13.4780 |
| Commercial |
3.9284 |
4.3730 |
4.8310 |
5.3360 |
5.8950 |
6.5110 |
| Industrial |
0.6375 |
0.7430 |
0.7820 |
0.8210 |
0.8630 |
0.9080 |
| Institutional |
1.7624 |
1.7860 |
1.9730 |
2.1800 |
2.4080 |
2.6600 |
| System Process |
0.5490 |
0.3000 |
0.3310 |
0.3660 |
0.4040 |
0.4460 |
| Unaccounted-for |
5.3545 |
5.5909 |
6.1625 |
6.7926 |
7.4884 |
8.2558 |
Demand v/s Percent of Supply
| |
2021 |
2030 |
2040 |
2050 |
2060 |
2070 |
| Surface Water Supply |
70.6000 |
70.6000 |
70.6000 |
70.6000 |
70.6000 |
70.6000 |
| Ground Water Supply |
0.0000 |
0.0000 |
0.0000 |
0.0000 |
0.0000 |
0.0000 |
| Purchases |
0.0000 |
0.0000 |
0.0000 |
0.0000 |
0.0000 |
0.0000 |
| Future Supplies |
0.0000 |
0.0000 |
0.0000 |
0.0000 |
0.0000 |
| Total Available Supply (MGD) |
70.6000 |
70.6000 |
70.6000 |
70.6000 |
70.6000 |
70.6000 |
| Service Area Demand |
20.9223 |
21.8459 |
24.0795 |
26.5416 |
29.2604 |
32.2588 |
| Sales |
0.8817 |
1.7900 |
1.7900 |
1.7900 |
1.7900 |
1.7900 |
| Future Sales |
0.0000 |
0.0000 |
0.0000 |
0.0000 |
0.0000 |
| Total Demand (MGD) |
21.8040 |
23.6359 |
25.8695 |
28.3316 |
31.0504 |
34.0488 |
| Demand as Percent of Supply |
31% |
33% |
37% |
40% |
44% |
48% |

The purpose of the above chart is to show a general indication of how the long-term per capita water demand changes over time. The per capita water demand may actually be different than indicated due to seasonal populations and the accuracy of data submitted. Water systems that have calculated long-term per capita water demand based on a methodology that produces different results may submit their information in the notes field.
Your long-term water demand is 56 gallons per capita per day. What demand management practices do you plan to implement to reduce the per capita water demand (i.e. conduct regular water audits, implement a plumbing retrofit program, employ practices such as rainwater harvesting or reclaimed water)? If these practices are covered elsewhere in your plan, indicate where the practices are discussed here.
No Changes
Are there other demand management practices you will implement to reduce your future supply needs? Asheville has implemented the following practices that could reduce the per capita demand: 1) meter replacement program; 20 water conservation public education program; 3) leak detection program; and 4) an aggressive non-revenue water program to reduce water loss.
What supplies other than the ones listed in future supplies are being considered to meet your future supply needs? None are being considered at this time.
How does the water system intend to implement the demand management and supply planning components above? 1) Meter Replacement Program: The department has bid out the next round of meters and is moving forward for meter replacement in 2022-2023 to replace our Automatic Meter Reading (AMR) system with Advanced Metering Infrastructure (AMI). 2) Water Conservation Public Education: Water Production Staff, Water Resources ISO Program Coordinator, and River Keepers to resume tours of the treatment facilities to various education groups in 2022 or once COVID numbers decrease. The department also partners with Land-of-Sky Regional Council Waste Reduction Partners annually for $15,000 to conduct commercial water audits and to provide assistance to area schools interested in pursuing student water education programs. 3) Leak Detection Program: the leak detection program consists of two (2) Utility System Mappers, who do so on as-needed basis. The DigiCorr leak detection system by Flow Metrix, Inc. is the type of leak detection equipment used. The DigiCorr Pro mapping and database software is used in conjunction with the DigiCorr equipment; and 4) Non-Revenue Water Program: The department continues to contract with Cavanaugh & Associates to track non-revenue water. Water loss has been reduced approximately 19%.
Additional Information
Has this system participated in regional water supply or water use planning? Yes, The department is currently under contract with Hazen and Sawyer to update the Water System Master Plan to project area growth and system expansion needed to accommodate the projected growth. The department continues to contract with industry experts Cavanaugh & Associates to assist in a systematic program to reduce non-revenue water. Overall, the department has reduced its non-revenue water by approximately 19%.
What major water supply reports or studies were used for planning? 2009 Water System Master Plan Update, 2011 Water and Sewer Rate Study; AWWA Water Audit and Drought Model.
Please describe any other needs or issues regarding your water supply sources, any water system deficiencies or needed improvements (storage, treatment, etc.) or your ability to meet present and future water needs. Include both quantity and quality considerations, as well as financial, technical, managerial, permitting, and compliance issues: Currently, the 23 year old Mills River Water Treatment Facility's Phase 1 updates/improvements are scheduled to be completed in May 2022. Phase 2 will be bid out in the Summer of 2022. The project includes another off-stream raw water storage reservoir, an additional 1 MG clearwell, an additional waste lagoon, additional intake pump & replacing the older pumps , new finished water pumps, new drives for all these pumps, addition of I-Beam trains in transfer pumps and intake to aid in future maintenance of motors, new chemical tanks for all bulk chemicals, new chemical injection pumps, new rapid mixers and flocculator and associated drives, new filter consoles, and update to SCADA integration and controls. The cost of this project is $15M and will take almost 2 years to complete. We are researching opportunities for grants/low interest loans for the Mills River WTP Phase 2 project along with the design for the retrofit of the North Fork and William DeBruhl WTPs to move from direct filtration to conventional treatment. NC Public Water Supply informed utilities in 2021 that Direct Filtration Plants would be required to move to Conventional Treatment.
The Division of Water Resources (DWR) provides the data contained within this
Local Water Supply Plan (LWSP) as a courtesy and service to our customers.
DWR staff does not field verify data. Neither DWR, nor any other party
involved in the preparation of this LWSP attests that the data is completely
free of errors and omissions. Furthermore, data users are cautioned that
LWSPs labeled PROVISIONAL have yet to be reviewed by DWR staff. Subsequent
review may result in significant revision. Questions regarding the accuracy
or limitations of usage of this data should be directed to the water system
and/or DWR.
|