|
The Division of Water Resources (DWR) provides the data contained within this
Local Water Supply Plan (LWSP) as a courtesy and service to our customers.
DWR staff does not field verify data. Neither DWR, nor any other party
involved in the preparation of this LWSP attests that the data is completely
free of errors and omissions. Furthermore, data users are cautioned that
LWSPs labeled PROVISIONAL have yet to be reviewed by DWR staff. Subsequent
review may result in significant revision. Questions regarding the accuracy
or limitations of usage of this data should be directed to the water system
and/or DWR.
1. System Information
Contact Information
Complete
| Water System Name: |
Brentwood-Highway 64 |
|
PWSID: |
01-12-103 |
| Mailing Address: | PO Box 627
Glen Alpine, NC 28628 | Ownership: | Non-Profit |
| |
| Contact Person: | Kendall Powell | Title: | Manager |
| Phone: | 828-584-4566 | Cell/Mobile: | -- |
Distribution System
| Line Type |
Size Range (Inches) |
Estimated % of lines |
| Ductile Iron |
6-12 |
10.00 % |
| Polyvinyl Chloride |
2-8 |
90.00 % |
Programs
We read the City of Morganton's master meters daily and record usage.
We have SCADA set up at pump houses for daily recorded use to watch for large drops in tank level.
We compare gallons sold to gallons purchased monthly. Water Conservation
2. Water Use Information
Service Area
| Sub-Basin(s) | % of Service Population |
|---|
| Catawba River (03-1) | 100 % |
|
| County(s) | % of Service Population |
|---|
| Burke | 100 % |
|
We bill all customers from both systems together so we just divide the population in half and the water use in half to determine the amounts for each side.
We have two system PWSID numbers 01-12-103 and 01-12-104.
We only have the one map for both the systems.
These were individual systems years ago but we now have them tied together to better operate the systems.
Water Use by Type
| Type of Use |
Metered
Connections |
Metered
Average Use (MGD) |
Non-Metered
Connections |
Non-Metered
Estimated Use (MGD) |
| Residential |
2,289 |
0.3116 |
0 |
0.0000 |
| Commercial |
35 |
0.0100 |
0 |
0.0000 |
| Industrial |
0 |
0.0000 |
0 |
0.0000 |
| Institutional |
24 |
0.0030 |
0 |
0.0000 |
How much water was used for system processes (backwash, line cleaning, flushing, etc.)? 0.0200 MGD
3. Water Supply Sources
Monthly Withdrawals & Purchases
|
Average Daily
Use (MGD) |
Max Day
Use (MGD) |
|
Average Daily
Use (MGD) |
Max Day
Use (MGD) |
|
Average Daily
Use (MGD) |
Max Day
Use (MGD) |
| Jan |
0.3647 |
0.4075 |
May |
0.3695 |
0.4065 |
Sep |
0.4030 |
0.4120 |
| Feb |
0.3787 |
0.3975 |
Jun |
0.3862 |
0.4820 |
Oct |
0.4106 |
0.4375 |
| Mar |
0.3340 |
0.3675 |
Jul |
0.4031 |
0.4835 |
Nov |
0.3807 |
0.4085 |
| Apr |
0.3554 |
0.4085 |
Aug |
0.3863 |
0.4025 |
Dec |
0.3693 |
0.3950 |

Water Purchases From Other Systems
| Seller |
PWSID |
Average
Daily Purchased
(MGD) |
Days
Used |
Contract |
Required to
comply with water
use restrictions? |
Pipe Size(s)
(Inches) |
Use
Type |
| MGD |
Expiration |
Recurring |
| Morganton |
01-12-015 |
0.3857 |
365 |
0.6500 |
2026 |
Yes |
Yes |
12 |
Regular |
We have 3 connections to the City of Morganton.
Average daily purchased came from the number of gallons Morganton billed Brentwood Water for water in 2024 divided by 365 divided by 2 systems. 4. Wastewater Information
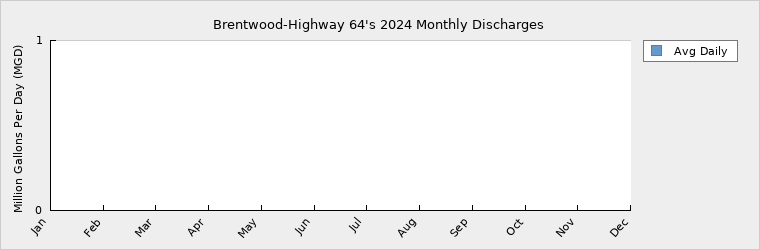
Monthly Discharges
|
Average Daily
Discharge (MGD) |
|
Average Daily
Discharge (MGD) |
|
Average Daily
Discharge (MGD) |
| Jan |
0.0000 |
May |
0.0000 |
Sep |
0.0000 |
| Feb |
0.0000 |
Jun |
0.0000 |
Oct |
0.0000 |
| Mar |
0.0000 |
Jul |
0.0000 |
Nov |
0.0000 |
| Apr |
0.0000 |
Aug |
0.0000 |
Dec |
0.0000 |
5. Planning
Projections
| |
2024 |
2030 |
2040 |
2050 |
2060 |
2070 |
| Year-Round Population |
5,870 |
6,050 |
6,350 |
6,650 |
6,950 |
7,250 |
| Seasonal Population |
0 |
0 |
0 |
0 |
0 |
0 |
| |
| Residential |
0.3116 |
0.3207 |
0.3366 |
0.3525 |
0.3684 |
0.3843 |
| Commercial |
0.0100 |
0.0100 |
0.0100 |
0.0100 |
0.0100 |
0.0100 |
| Industrial |
0.0000 |
0.0000 |
0.0000 |
0.0000 |
0.0000 |
0.0000 |
| Institutional |
0.0030 |
0.0030 |
0.0030 |
0.0030 |
0.0030 |
0.0030 |
| System Process |
0.0200 |
0.0200 |
0.0200 |
0.0200 |
0.0200 |
0.0200 |
| Unaccounted-for |
0.0400 |
0.0430 |
0.0480 |
0.0530 |
0.0580 |
0.0630 |
Demand v/s Percent of Supply
| |
2024 |
2030 |
2040 |
2050 |
2060 |
2070 |
| Surface Water Supply |
0.0000 |
0.0000 |
0.0000 |
0.0000 |
0.0000 |
0.0000 |
| Ground Water Supply |
0.0000 |
0.0000 |
0.0000 |
0.0000 |
0.0000 |
0.0000 |
| Purchases |
0.6500 |
0.6500 |
0.6500 |
0.6500 |
0.6500 |
0.6500 |
| Future Supplies |
0.0000 |
0.0000 |
0.0000 |
0.0000 |
0.0000 |
| Total Available Supply (MGD) |
0.6500 |
0.6500 |
0.6500 |
0.6500 |
0.6500 |
0.6500 |
| Service Area Demand |
0.3846 |
0.3967 |
0.4176 |
0.4385 |
0.4594 |
0.4803 |
| Sales |
0.0000 |
0.0000 |
0.0000 |
0.0000 |
0.0000 |
0.0000 |
| Future Sales |
0.0000 |
0.0000 |
0.0000 |
0.0000 |
0.0000 |
| Total Demand (MGD) |
0.3846 |
0.3967 |
0.4176 |
0.4385 |
0.4594 |
0.4803 |
| Demand as Percent of Supply |
59% |
61% |
64% |
67% |
71% |
74% |

The purpose of the above chart is to show a general indication of how the long-term per capita water demand changes over time. The per capita water demand may actually be different than indicated due to seasonal populations and the accuracy of data submitted. Water systems that have calculated long-term per capita water demand based on a methodology that produces different results may submit their information in the notes field.
Your long-term water demand is 53 gallons per capita per day. What demand management practices do you plan to implement to reduce the per capita water demand (i.e. conduct regular water audits, implement a plumbing retrofit program, employ practices such as rainwater harvesting or reclaimed water)? If these practices are covered elsewhere in your plan, indicate where the practices are discussed here.
Are there other demand management practices you will implement to reduce your future supply needs? The system will constantly work to reduce per capita usage by the implementation of an active water conservation public education program, an active leak detection program and a meter replacement program. The future per capita demands will be evaluated annually and additional measures will be implemented as needed to ensure that the per capita usage is being reduced.
What supplies other than the ones listed in future supplies are being considered to meet your future supply needs?
How does the water system intend to implement the demand management and supply planning components above?
Additional Information
Has this system participated in regional water supply or water use planning? No
What major water supply reports or studies were used for planning?
Please describe any other needs or issues regarding your water supply sources, any water system deficiencies or needed improvements (storage, treatment, etc.) or your ability to meet present and future water needs. Include both quantity and quality considerations, as well as financial, technical, managerial, permitting, and compliance issues:
The Division of Water Resources (DWR) provides the data contained within this
Local Water Supply Plan (LWSP) as a courtesy and service to our customers.
DWR staff does not field verify data. Neither DWR, nor any other party
involved in the preparation of this LWSP attests that the data is completely
free of errors and omissions. Furthermore, data users are cautioned that
LWSPs labeled PROVISIONAL have yet to be reviewed by DWR staff. Subsequent
review may result in significant revision. Questions regarding the accuracy
or limitations of usage of this data should be directed to the water system
and/or DWR.
|