|
The Division of Water Resources (DWR) provides the data contained within this
Local Water Supply Plan (LWSP) as a courtesy and service to our customers.
DWR staff does not field verify data. Neither DWR, nor any other party
involved in the preparation of this LWSP attests that the data is completely
free of errors and omissions. Furthermore, data users are cautioned that
LWSPs labeled PROVISIONAL have yet to be reviewed by DWR staff. Subsequent
review may result in significant revision. Questions regarding the accuracy
or limitations of usage of this data should be directed to the water system
and/or DWR.
1. System Information
Contact Information
Provisional
| Water System Name: |
Concord |
|
PWSID: |
01-13-010 |
| Mailing Address: | Post Office Box 308
Concord, NC 28026 | Ownership: | Municipality |
| |
| Contact Person: | Crystal Allman | Title: | Water Resources Engineering Manager |
| Phone: | 704-920-5287 | Cell/Mobile: | -- |
Distribution System
| Line Type |
Size Range (Inches) |
Estimated % of lines |
| Asbestos Cement |
2-12 |
2.39 % |
| Cast Iron |
1-48 |
15.18 % |
| Ductile Iron |
2-30 |
18.48 % |
| Galvanized Iron |
1-4 |
1.25 % |
| Other |
24-48 |
0.48 % |
| Other |
1-2 |
0.04 % |
| Other |
2-2 |
0.27 % |
| Polyvinyl Chloride |
1-16 |
61.91 % |
The first line type identified as “Other”, with 24 to 48 inch size range, is concrete pipe. The next line type identified as “Other”, with 1 to 2 inch size range is copper. The final line type identified as “Other”, with 2 inch pipe is HDPE. Programs
The City's hydrant flushing program is managed by the Concord Fire and Life Safety Department.
The City implemented a Unidirectional Flushing Program in early 2020. The goal of this program is to split the City into zones and rotate through all these zones regularly.
A valve exercise program was initiated in 2010 and is in the process of being revised to be more comprehensive and regular.
In November 2011, a program was instituted that provides a $50 credit per toilet on customer's water bills for proof of replacement of old high flow toilets with WaterSense labeled toilets.
The City of Concord hires an outside company to conduct a Leak Survey of approximately 10% (80 miles) of our distribution system per year. This survey is done using acoustic and correlation techniques. The goal is to survey our whole system over the span of 10 years.
In addition, a contractor is notified when a leak is suspected in the Concord water system, and the contractor locates the leak via acoustic correlation techniques. An open contract for the performance of this service is maintained to ensure that the City has the ability to respond and investigate any potential leaks as soon as possible. Water Conservation
Concord and the Water and Sewer Authority of Cabarrus County continue to look for opportunities to use reclaimed water in an economically feasible situation. 2. Water Use Information
Service Area
| Sub-Basin(s) | % of Service Population |
|---|
| Rocky River (18-4) | 100 % |
|
| County(s) | % of Service Population |
|---|
| Cabarrus | 100 % |
| Mecklenburg | 0 % |
|
The population served includes Concord, Midland, and a small portion of unincorporated Cabarrus County. The year round population value is derived by multiplying the number of residential meters (44,139) by the average Concord household size from 2015-2019 U.S. Census Bureau Quick Facts data (2.62 persons/household). This population figure is not exact, but should be representative of the population served by the system as a whole. Water Use by Type
| Type of Use |
Metered
Connections |
Metered
Average Use (MGD) |
Non-Metered
Connections |
Non-Metered
Estimated Use (MGD) |
| Residential |
44,139 |
6.2680 |
0 |
0.0000 |
| Commercial |
3,142 |
2.0400 |
0 |
0.0000 |
| Industrial |
63 |
0.7440 |
0 |
0.0000 |
| Institutional |
476 |
0.2240 |
0 |
0.0000 |
How much water was used for system processes (backwash, line cleaning, flushing, etc.)? 2.1374 MGD
Metered connections are based on the total number of meters throughout the year. This number is affected by the AMR to AMI meter changeout.
Residential meters include customers inside and outside of the municipal limits, in addition to separate outdoor irrigation and spigot accounts. Commercial meters include customers inside and outside of the municipal limits, in addition to separate outdoor irrigation and spigot accounts. Concord went through a process this year of categorizing “institutional” customers as the following: schools, churches, prisons, etc.
System process water was calculated by subtracting the total finished water pumped (3698.054) from the total raw water withdrawal (4335.138) by both Coddle Creek and Hillgrove Water Treatment Plants for CY 2024, which is 637.084 MG. This is an average of 1.741 MGD. We added an estimated 0.38 MGD for the water used for flushing throughout the City, based on the timing of our automatic blow offs. We also added 0.0164 MGD for tanker truck usage. Thus 2.1374 MGD was our final amount for system processes. Water Sales
| Purchaser |
PWSID |
Average
Daily Sold
(MGD) |
Days
Used |
Contract |
Required to
comply with water
use restrictions? |
Pipe Size(s)
(Inches) |
Use
Type |
| MGD |
Expiration |
Recurring |
| Charlotte Water |
01-60-010 |
0.0000 |
0 |
1.0000 |
|
Yes |
Yes |
12&16 |
Emergency |
| City of Kannapolis |
01-80-065 |
0.5180 |
366 |
1.5000 |
2031 |
Yes |
Yes |
6-24 |
Regular |
| City of Kannapolis |
01-80-065 |
0.7610 |
358 |
2.0000 |
2050 |
Yes |
Yes |
24 |
Regular |
| Town of Harrisburg |
01-13-025 |
1.5940 |
366 |
2.0000 |
2023 |
Yes |
Yes |
12&16 |
Regular |
| Town of Mount Pleasant |
01-13-020 |
0.0050 |
21 |
0.2000 |
2018 |
Yes |
Yes |
12 |
Emergency |
Aqua Inc. operates a water system for the Springdale residential subdivision. Utilities Inc. operates a water system for the Zemosa Acres subdivision. No contracts exist between the City of Concord and these utilities. Service is provided to these utilities in the same manner that service is provided to any other Concord customer.
Concords contract with Charlotte Water was signed in 2002. The term of this contract provides for an automatic renewal every five years. Concords contract with Kannapolis was renewed in 2021 for a 10-year term. Concords contract with Harrisburg was signed in 2018 for a 5-year term and has been renewed annually since then. A new long-term contract is currently being negotiated to be into place before 6/30/25. Concords contract with Mt. Pleasant was signed in 2004 as a regular water connection and expired in 2016. There was a 2-year renewal period to 2018, and has only been used for emergency since that contract expired.
A portion of the jurisdiction of Mecklenburg County (Concord-Huntersville Road area) was served by the City of Concord until late 2021. The City also has many other master-metered connections to customers such as mobile home parks, apartment complexes, churches, and schools that may or may not have assigned public water system identification numbers. Water sales for each of these customers are based on meter size and usage. Certain areas within the jurisdiction of the City of Kannapolis are also served by Concords water system due to the proximity of the water systems to those properties. Additionally, a portion of the water system owned and operated by the City of Concord serves as the primary water system for the Town of Midland. Users in these areas are billed directly by the City.
Concord has two contracts with Kannapolis. One for IBT us (0.761 MGD average use and 2.0 MGD contract), and one for everyday normal use (0.518 MGD average use, and 1.5 MGD contract).
3. Water Supply Sources
Monthly Withdrawals & Purchases
|
Average Daily
Use (MGD) |
Max Day
Use (MGD) |
|
Average Daily
Use (MGD) |
Max Day
Use (MGD) |
|
Average Daily
Use (MGD) |
Max Day
Use (MGD) |
| Jan |
15.3320 |
16.1120 |
May |
16.6540 |
17.9990 |
Sep |
16.7140 |
18.7880 |
| Feb |
15.4430 |
16.6020 |
Jun |
17.6820 |
20.3370 |
Oct |
17.0850 |
18.1010 |
| Mar |
15.6090 |
16.9450 |
Jul |
17.1170 |
19.7020 |
Nov |
16.3910 |
17.4480 |
| Apr |
16.0540 |
16.9840 |
Aug |
17.9090 |
19.0270 |
Dec |
15.5070 |
16.6260 |
The numbers in this section are based on the City of Concord’s monthly drought report spreadsheets. Each number is the sum of the raw water withdrawn for Lake Don T. Howell, Lake Fisher, and Lake Concord plus the finished water purchased from Albemarle, Kannapolis and Charlotte Water.
A total of 1707.146 MG of finished water was purchased from Albemarle. A total of 0.174 MG of finished water was purchased from the City of Kannapolis in CY 2024. A total of 0.625 MG of finished water was purchased from Charlotte Water in CY 2024.

Surface Water Sources
| Stream |
Reservoir |
Average Daily Withdrawal |
Maximum Day
Withdrawal (MGD) |
Available Raw
Water Supply |
Usable On-Stream
Raw Water Supply
Storage (MG) |
| MGD |
Days Used |
MGD |
* Qualifier |
| Coddle Creek |
Lake Don T. Howell |
7.3380 |
366 |
11.3440 |
11.1200 |
C |
5,296.0000 |
| Cold Water Creek |
Lake Fisher |
5.0050 |
331 |
6.5220 |
3.9000 |
SY50 |
750.0000 |
| Unnamed Trib Cold Water Creek |
Lake Concord |
0.0000 |
0 |
0.0000 |
0.8000 |
SY50 |
179.0000 |
* Qualifier: C=Contract Amount, SY20=20-year Safe Yield, SY50=50-year Safe Yield, F=20% of 7Q10 or other instream flow requirement, CUA=Capacity Use Area Permit
Surface Water Sources (continued)
| Stream |
Reservoir |
Drainage Area
(sq mi) |
Metered? |
Sub-Basin |
County |
Year
Offline |
Use
Type |
| Coddle Creek |
Lake Don T. Howell |
47 |
Yes |
Rocky River (18-4) |
Cabarrus |
|
Regular |
| Cold Water Creek |
Lake Fisher |
19 |
Yes |
Rocky River (18-4) |
Cabarrus |
|
Regular |
| Unnamed Trib Cold Water Creek |
Lake Concord |
5 |
Yes |
Rocky River (18-4) |
Cabarrus |
|
Emergency |
The total permitted raw water withdrawal from Lake Don T. Howell (Coddle Creek reservoir) is 14.6 MGD. This reservoir also serves the City of Kannapolis. Concord’s usable volume is 12.0 MGD by agreement between Concord and Kannapolis, based upon the percentage of the reservoir’s operation and maintenance cost paid by Concord. A minimum flow is required downstream of Lake Don T. Howell in Coddle Creek.
The City of Concord (Rocky River Basin) currently has emergency interconnections with Charlotte-Mecklenburg Utilities (Catawba River Basin) that will eventually become regular interbasin transfer locations at such time the demand becomes great enough. The completed water line from Albemarle (Yadkin River Basin) has been an additional regular interbasin transfer. An Interbasin Transfer Certificate was issued January 10, 2007 by the Environmental Management Commission approving these transfers.
The safe yields have been updated per the FY22 WSACC Master Plan. Water Purchases From Other Systems
| Seller |
PWSID |
Average
Daily Purchased
(MGD) |
Days
Used |
Contract |
Required to
comply with water
use restrictions? |
Pipe Size(s)
(Inches) |
Use
Type |
| MGD |
Expiration |
Recurring |
| Charlotte Water |
01-60-010 |
0.0208 |
3 |
5.0000 |
|
Yes |
Yes |
12&16 |
Regular |
| City of Albemarle |
01-84-010 |
4.6640 |
366 |
5.0000 |
2040 |
Yes |
Yes |
30 |
Regular |
| City of Kannapolis |
01-80-065 |
0.1770 |
366 |
1.5000 |
2020 |
Yes |
Yes |
6-24 |
Regular |
| Town of Mount Pleasant |
01-13-020 |
0.0000 |
0 |
0.2000 |
2018 |
Yes |
Yes |
12 |
Emergency |
Certain individual customers are served by Charlotte-Mecklenburg Utilities and the City of Kannapolis due to proximity of their water systems to those properties at the time they were developed. The City of Concord is billed monthly based on customer meter reading.
The purchase water contract with Charlotte Water is listed as a regular use connection to account for the ability that Concord has to purchase up to 5 MGD as needed.
A total of 1707.146 MG of finished water was purchased from Albemarle. A total of 0.174 MG of finished water was purchased from the City of Kannapolis in CY 2024. A total of 0.625 MG of finished water was purchased from Charlotte Water in CY 2024. Water Treatment Plants
| Plant Name |
Permitted Capacity
(MGD) |
Is Raw Water Metered? |
Is Finished Water Ouput Metered? |
Source |
| Coddle Creek WTP |
12.0000 |
Yes |
Yes |
Lake Don T. Howell |
| Hillgrove WTP |
12.0000 |
Yes |
Yes |
Lake Fisher, Lake Concord, Lake Don T. Howell |
4. Wastewater Information
Monthly Discharges
|
Average Daily
Discharge (MGD) |
|
Average Daily
Discharge (MGD) |
|
Average Daily
Discharge (MGD) |
| Jan |
11.3208 |
May |
11.2984 |
Sep |
11.3772 |
| Feb |
11.2326 |
Jun |
11.3600 |
Oct |
11.3497 |
| Mar |
11.2082 |
Jul |
11.3880 |
Nov |
11.3305 |
| Apr |
11.2813 |
Aug |
11.3878 |
Dec |
11.3218 |
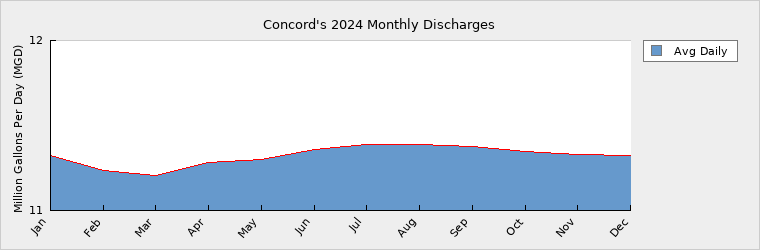
The Water and Sewer Authority of Cabarrus County (WSACC) provides regional wastewater treatment for the City of Concord, City of Kannapolis, Town of Harrisburg, Town of Mount Pleasant, Town of Midland, and Charlotte-Mecklenburg Utilities. The Average Daily Discharge provided in this section is the result of the monthly flow that WSACC billed Concord divided by the number of days in the month. This number includes discharges from the Town of Midland as well. Concord is the water and sewer provider for the Town of Midland. The number of sewer service connections is based on the total number of sewer billing accounts that the City of Concord had in December 2018. The number of water service connections with septic systems is based on a coding in the billing system that tracks meters that are not charged for sewer that are not irrigation meters.
The City of Concord does not own or operate a wastewater treatment facility; however, WSACC completed the first phase of an expansion to gain sewer capacity in FY2024, with the second phase to be completed in FY2027 at the Rocky River Regional Wastewater Treatment Facility (NC0036269) for the purposes of WSACC meeting the existing permitted capacity of the plant facility.
Wastewater Permits
| Permit Number |
Type |
Permitted Capacity
(MGD) |
Design Capacity
(MGD) |
Average Annual
Daily Discharge
(MGD) |
Maximum Day Discharge
(MGD) |
Receiving Stream |
Receiving Basin |
| NC0083119 |
WTP |
0.0000 |
0.0000 |
0.6484 |
1.3961 |
Coddle Creek |
Rocky River (18-4) |
| WQCS00326 |
WWTP |
0.0000 |
0.0000 |
0.0000 |
0.0000 |
Rocky River & Muddy Creek |
Rocky River (18-4) |
Discharge permit NC0083119 regulates the lagoon discharge from the Coddle Creek Water Treatment Facility. The permitted capacity, 0.6 MGD is a monthly average limit. Concords maximum day discharge occurred on January 9, 2024.
Permit WQCS00326 had an estimated maximum discharge of 42.6279 MGD. This number was calculated by multiplying Rocky River Wastewater Treatment Facilitys max day discharge by 50%, based on Concord using an average of 50% of the flow at Rocky River Regional Wastewater Treatment Facility and adding the max of 0.7199 from Muddy Creek.
The Citys wastewater collection system (WQCS00326) discharges to two NPDES facilities owned and operated by the Water and Sewer Authority of Cabarrus County (WSACC). Rocky River Regional Wastewater Treatment Facility (NC0036269) and Muddy Creek Wastewater Treatment Facility (NC0081621).
Average daily discharge under permit WQCS00326 is recorded in the interconnection section below.
Wastewater Interconnections
| Water System |
PWSID |
Type |
Average Daily Amount |
Contract
Maximum (MGD) |
| MGD |
Days Used |
| Water Sewer Authority Cabarrus Co. |
01-13-999 |
Discharging |
10.6750 |
366 |
|
| City of Kannapolis |
01-80-065 |
Receiving |
0.0870 |
366 |
1.5000 |
No contractual limit exists for the amount of wastewater flow WSACC will accept from the City of Concord. Concord is billed based on WSACCs sewer meter data. Surcharge fees may be assessed for excessive inflow and infiltration.
Certain individual customers in other jurisdictions are served by Concords wastewater collection system due to topography and the systems proximity to those properties. These customers are billed based on water meter readings, even though some of these customers receive water service from another jurisdiction.
5. Planning
Projections
| |
2024 |
2030 |
2040 |
2050 |
2060 |
2070 |
| Year-Round Population |
115,203 |
127,852 |
145,709 |
158,209 |
165,708 |
172,337 |
| Seasonal Population |
0 |
0 |
0 |
0 |
0 |
0 |
| |
| Residential |
6.2680 |
6.9560 |
8.1660 |
9.1320 |
8.8520 |
10.5530 |
| Commercial |
2.0400 |
2.2640 |
2.6580 |
2.9720 |
3.2060 |
3.4350 |
| Industrial |
0.7440 |
2.6260 |
3.0820 |
3.4470 |
3.7190 |
3.9830 |
| Institutional |
0.2240 |
0.2490 |
0.2920 |
0.3260 |
0.3520 |
0.3770 |
| System Process |
2.1374 |
3.4140 |
4.0070 |
4.4820 |
4.8350 |
5.1790 |
| Unaccounted-for |
2.4355 |
3.3095 |
3.8848 |
4.3444 |
4.4735 |
5.0204 |
Population projections from the Water and Sewer Authority of Cabarrus Countys (WSACC) 2002 Water and Wastewater Master Plan prepared by Black & Veatch were high due to the economic slow-down. Therefore, LandDesigns population projections for the WSACC 2013-2014 Master Plan were based on demographic projections and were used to create growth rates for the time periods 2017 to 2060 (6.28% increase from 2016 to 2020, 18.30% increase from 2020 to 2030, 13.97% increase from 2030 to 2040, 8.58% increase from 2040 to 2050, and 4.74% increase from 2050 to 2060). Water use by type percentages were assumed to be steady going forward; for example, Residential usage in 2012 was 55.3% of the total usage thus the Residential is 55.3% of the total usage for 2020 through 2060.
The industrial jump from 2024 to 2030 is due to economic development projects. Future Water Sales
| Purchaser |
PWSID |
Contract |
Pipe Size(s) (Inches) |
Use Type |
| MGD |
Year Begin |
Year End |
| City of Kannapolis |
01-80-065 |
2.0000 |
2040 |
|
|
Regular |
Future Supply Sources
| Source Name |
PWSID |
Source Type |
Additional Supply |
Year Online |
Year Offline |
Type |
| Charlotte Water |
01-60-010 |
Purchase |
1.0000 |
2030 |
|
Regular |
| City of Albemarle |
01-84-010 |
Purchase |
5.0000 |
2040 |
|
Regular |
Demand v/s Percent of Supply
| |
2024 |
2030 |
2040 |
2050 |
2060 |
2070 |
| Surface Water Supply |
15.0200 |
15.0200 |
15.0200 |
15.0200 |
15.0200 |
15.0200 |
| Ground Water Supply |
0.0000 |
0.0000 |
0.0000 |
0.0000 |
0.0000 |
0.0000 |
| Purchases |
11.5000 |
11.5000 |
11.5000 |
11.5000 |
11.5000 |
11.5000 |
| Future Supplies |
1.0000 |
6.0000 |
6.0000 |
6.0000 |
6.0000 |
| Total Available Supply (MGD) |
26.5200 |
27.5200 |
32.5200 |
32.5200 |
32.5200 |
32.5200 |
| Service Area Demand |
13.8489 |
18.8185 |
22.0898 |
24.7034 |
25.4375 |
28.5474 |
| Sales |
2.8567 |
5.5000 |
5.5000 |
5.5000 |
5.5000 |
5.5000 |
| Future Sales |
0.0000 |
2.0000 |
2.0000 |
2.0000 |
2.0000 |
| Total Demand (MGD) |
16.7056 |
24.3185 |
29.5898 |
32.2034 |
32.9375 |
36.0474 |
| Demand as Percent of Supply |
63% |
88% |
91% |
99% |
101% |
111% |

The purpose of the above chart is to show a general indication of how the long-term per capita water demand changes over time. The per capita water demand may actually be different than indicated due to seasonal populations and the accuracy of data submitted. Water systems that have calculated long-term per capita water demand based on a methodology that produces different results may submit their information in the notes field.
Your long-term water demand is 54 gallons per capita per day. What demand management practices do you plan to implement to reduce the per capita water demand (i.e. conduct regular water audits, implement a plumbing retrofit program, employ practices such as rainwater harvesting or reclaimed water)? If these practices are covered elsewhere in your plan, indicate where the practices are discussed here.
Are there other demand management practices you will implement to reduce your future supply needs?
What supplies other than the ones listed in future supplies are being considered to meet your future supply needs?
How does the water system intend to implement the demand management and supply planning components above?
Additional Information
Has this system participated in regional water supply or water use planning? Yes, Yes, The City of Concord participated in the Water and Sewer Authority of Cabarrus Countys (WSACC) 2002 Water and Wastewater Master Plan prepared by Black & Veatch. Area utilities also conducted an intense planning study in conjunction with the preparation of an Interbasin Transfer Permit application, which was approved in January of 2007. In addition, the City of Concord was involved in the update of WSACCs wastewater master plan in 2013-2014 working with LandDesign.
What major water supply reports or studies were used for planning? The City has used information from the Black & Veatch 2002 Water and Wastewater Master Plan, the CH2M Hill Environmental Impact Statement information and the Hazen & Sawyer 2016 Water Master Plan to plan for future water supply needs. We are currently working on an update to our 2016 Water Master Plan.
Please describe any other needs or issues regarding your water supply sources, any water system deficiencies or needed improvements (storage, treatment, etc.) or your ability to meet present and future water needs. Include both quantity and quality considerations, as well as financial, technical, managerial, permitting, and compliance issues: New extensions will be needed to connect to future water supply sources, as permitted by the approved Interbasin Transfer Certificate. The transfer of finished water from the City of Albemarle (Yadkin basin) into Concords water system started in July of 2016. CH2M Hill prepared a hydraulic model of the Citys system in 2009, and Hazen & Sawyer completed the hydraulic water model update in 2016, which included the recalibration of the water model. The City has entered into a contract with HDR, Inc. to study disinfection by-products at the Hillgrove WTP and within the water distribution system. The consultant has provided the final report for their recommendation to reduce DBP formation at the WTP. Recommendations have been evaluated by staff and the CIP has been updated for future years to include money to implement the upgrades. In addition, the City has also entered into a contract with Hazen & Sawyer to study disinfection by-products at the Mt. Pleasant Water Pump Station for the wholesale water purchase from the City of Albemarle. The consultant evaluated options and provided a tech memo of the findings and recommendations. Concord staff are evaluating the recommendations. The City put a 2 MG elevated storage tank online in 2012 to provide additional storage in the largest of the Citys pressure zones.
The Division of Water Resources (DWR) provides the data contained within this
Local Water Supply Plan (LWSP) as a courtesy and service to our customers.
DWR staff does not field verify data. Neither DWR, nor any other party
involved in the preparation of this LWSP attests that the data is completely
free of errors and omissions. Furthermore, data users are cautioned that
LWSPs labeled PROVISIONAL have yet to be reviewed by DWR staff. Subsequent
review may result in significant revision. Questions regarding the accuracy
or limitations of usage of this data should be directed to the water system
and/or DWR.
|