|
The Division of Water Resources (DWR) provides the data contained within this
Local Water Supply Plan (LWSP) as a courtesy and service to our customers.
DWR staff does not field verify data. Neither DWR, nor any other party
involved in the preparation of this LWSP attests that the data is completely
free of errors and omissions. Furthermore, data users are cautioned that
LWSPs labeled PROVISIONAL have yet to be reviewed by DWR staff. Subsequent
review may result in significant revision. Questions regarding the accuracy
or limitations of usage of this data should be directed to the water system
and/or DWR.
1. System Information
Contact Information
Complete
| Water System Name: |
Water and Sewer Authority of Cabarrus County |
|
PWSID: |
01-13-999 |
| Mailing Address: | 232 Davidson Highway
Concord, NC 28027 | Ownership: | Authority |
| |
| Contact Person: | Thomas Hahn | Title: | Engineering Director |
| Phone: | 704-786-1783 | Cell/Mobile: | -- |
| |
| Secondary Contact: | Mayara Arnold | | Phone: | 704-786-1783 |
| Mailing Address: | 232 Davidson Highway
Concord, NC 28027 | Cell/Mobile: | -- |
Distribution System
| Line Type |
Size Range (Inches) |
Estimated % of lines |
| Other |
0 |
100.00 % |
WSACC manages Lake Howell for its member jurisdictions. Concord/Kannapolis are responsible for withdrawal, treatment, and distribution. Programs
WSACC does not operate a distribution system. Water Conservation
Each of WSACC's member jurisdictions uses different rate systems. 2. Water Use Information
Service Area
| Sub-Basin(s) | % of Service Population |
|---|
| Rocky River (18-4) | 100 % |
|
| County(s) | % of Service Population |
|---|
| Cabarrus | 100 % |
|
WSACC is a raw water supply only, so population directly served is 0. Population of Cabarrus County (from 2023 US census estimates) is 240,016. WSACC only bills its five member jurisdictions and does not regularly track the exact number of billing meters per system. Water Use by Type
| Type of Use |
Metered
Connections |
Metered
Average Use (MGD) |
Non-Metered
Connections |
Non-Metered
Estimated Use (MGD) |
| Residential |
0 |
0.0000 |
0 |
0.0000 |
| Commercial |
0 |
0.0000 |
0 |
0.0000 |
| Industrial |
0 |
0.0000 |
0 |
0.0000 |
| Institutional |
0 |
0.0000 |
0 |
0.0000 |
How much water was used for system processes (backwash, line cleaning, flushing, etc.)? 0.0000 MGD
WSACC is a raw water supplier only. See data from the WSACC member jurisdictions for the information requested above. 3. Water Supply Sources
Monthly Withdrawals & Purchases
|
Average Daily
Use (MGD) |
Max Day
Use (MGD) |
|
Average Daily
Use (MGD) |
Max Day
Use (MGD) |
|
Average Daily
Use (MGD) |
Max Day
Use (MGD) |
| Jan |
0.0000 |
0.0000 |
May |
0.0000 |
0.0000 |
Sep |
0.0000 |
0.0000 |
| Feb |
0.0000 |
0.0000 |
Jun |
0.0000 |
0.0000 |
Oct |
0.0000 |
0.0000 |
| Mar |
0.0000 |
0.0000 |
Jul |
0.0000 |
0.0000 |
Nov |
0.0000 |
0.0000 |
| Apr |
0.0000 |
0.0000 |
Aug |
0.0000 |
0.0000 |
Dec |
0.0000 |
0.0000 |
WSACC is a raw water supplier only. See data from the WSACC member jurisdictions for the information requested above. 
Surface Water Sources
| Stream |
Reservoir |
Average Daily Withdrawal |
Maximum Day
Withdrawal (MGD) |
Available Raw
Water Supply |
Usable On-Stream
Raw Water Supply
Storage (MG) |
| MGD |
Days Used |
MGD |
* Qualifier |
| Coddle Creek |
Lake Don T. Howell |
0.0000 |
0 |
0.0000 |
13.9000 |
SY50 |
6,689.0000 |
* Qualifier: C=Contract Amount, SY20=20-year Safe Yield, SY50=50-year Safe Yield, F=20% of 7Q10 or other instream flow requirement, CUA=Capacity Use Area Permit
Surface Water Sources (continued)
| Stream |
Reservoir |
Drainage Area
(sq mi) |
Metered? |
Sub-Basin |
County |
Year
Offline |
Use
Type |
| Coddle Creek |
Lake Don T. Howell |
47 |
Yes |
Rocky River (18-4) |
Cabarrus |
|
Regular |
Required minimum releases downstream of the Lake Howell dam range from 2 cfs to 6 cfs depending on drought stage, lake level, inflow, and associated conditions. 4. Wastewater Information
Monthly Discharges
|
Average Daily
Discharge (MGD) |
|
Average Daily
Discharge (MGD) |
|
Average Daily
Discharge (MGD) |
| Jan |
26.5077 |
May |
22.7806 |
Sep |
25.0677 |
| Feb |
21.2924 |
Jun |
19.1107 |
Oct |
19.8545 |
| Mar |
24.2819 |
Jul |
20.7458 |
Nov |
19.4773 |
| Apr |
20.8957 |
Aug |
24.7268 |
Dec |
21.9316 |
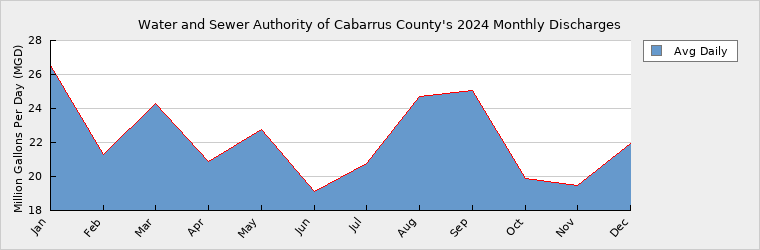
WSACC serves five wholesale customers - Concord, Kannapolis, Mt. Pleasant, Harrisburg, and Charlotte Water. Flows listed above are for the Rocky River Regional WWTP (RRRWWTP). Construction is underway for the design-build expansion of the RRRWWTP. Wastewater Permits
| Permit Number |
Type |
Permitted Capacity
(MGD) |
Design Capacity
(MGD) |
Average Annual
Daily Discharge
(MGD) |
Maximum Day Discharge
(MGD) |
Receiving Stream |
Receiving Basin |
| NC0036269 |
WWTP |
30.0000 |
30.0000 |
22.2397 |
83.8200 |
Rocky River |
Rocky River (18-4) |
| NC0081621 |
WWTP |
0.3000 |
0.3000 |
0.1972 |
0.7200 |
Rocky River |
Rocky River (18-4) |
WSACC completed the expansion of the Muddy Creek WWTP (NC0081621) from 0.15 MGD to 0.30 MGD in March 2019. WSACC completed Phase 3 Capacity upgrades at the RRRWWTP (NC0036269) from 26.5 MGD to 30.0 MGD in October 2024. Construction is underway for the Phase 4 design-build expansion at the RRRWWTP to 34 MGD. Wastewater Interconnections
| Water System |
PWSID |
Type |
Average Daily Amount |
Contract
Maximum (MGD) |
| MGD |
Days Used |
| City of Charlotte |
01-60-010 |
Receiving |
5.0443 |
366 |
7.4000 |
| City of Concord |
01-13-010 |
Receiving |
10.6804 |
366 |
|
| City of Kannapolis |
01-80-065 |
Receiving |
4.5803 |
366 |
|
| Town of Harrisburg |
01-13-025 |
Receiving |
2.0134 |
366 |
|
| Town of Mount Pleasant |
01-13-020 |
Receiving |
0.2237 |
366 |
|
5. Planning
Projections
| |
2024 |
2030 |
2040 |
2050 |
2060 |
2070 |
| Year-Round Population |
0 |
0 |
0 |
0 |
0 |
0 |
| Seasonal Population |
0 |
0 |
0 |
0 |
0 |
0 |
| |
| Residential |
0.0000 |
0.0000 |
0.0000 |
0.0000 |
0.0000 |
0.0000 |
| Commercial |
0.0000 |
0.0000 |
0.0000 |
0.0000 |
0.0000 |
0.0000 |
| Industrial |
0.0000 |
0.0000 |
0.0000 |
0.0000 |
0.0000 |
0.0000 |
| Institutional |
0.0000 |
0.0000 |
0.0000 |
0.0000 |
0.0000 |
0.0000 |
| System Process |
0.0000 |
0.0000 |
0.0000 |
0.0000 |
0.0000 |
0.0000 |
| Unaccounted-for |
0.0000 |
0.0000 |
0.0000 |
0.0000 |
0.0000 |
0.0000 |
WSACC is a raw water supplier only. See data from the WSACC member jurisdictions for the information requested above. Demand v/s Percent of Supply
| |
2024 |
2030 |
2040 |
2050 |
2060 |
2070 |
| Surface Water Supply |
13.9000 |
13.9000 |
13.9000 |
13.9000 |
13.9000 |
13.9000 |
| Ground Water Supply |
0.0000 |
0.0000 |
0.0000 |
0.0000 |
0.0000 |
0.0000 |
| Purchases |
0.0000 |
0.0000 |
0.0000 |
0.0000 |
0.0000 |
0.0000 |
| Future Supplies |
0.0000 |
0.0000 |
0.0000 |
0.0000 |
0.0000 |
| Total Available Supply (MGD) |
13.9000 |
13.9000 |
13.9000 |
13.9000 |
13.9000 |
13.9000 |
| Service Area Demand |
0.0000 |
0.0000 |
0.0000 |
0.0000 |
0.0000 |
0.0000 |
| Sales |
0.0000 |
0.0000 |
0.0000 |
0.0000 |
0.0000 |
0.0000 |
| Future Sales |
0.0000 |
0.0000 |
0.0000 |
0.0000 |
0.0000 |
| Total Demand (MGD) |
0.0000 |
0.0000 |
0.0000 |
0.0000 |
0.0000 |
0.0000 |
| Demand as Percent of Supply |
0% |
0% |
0% |
0% |
0% |
0% |

The purpose of the above chart is to show a general indication of how the long-term per capita water demand changes over time. The per capita water demand may actually be different than indicated due to seasonal populations and the accuracy of data submitted. Water systems that have calculated long-term per capita water demand based on a methodology that produces different results may submit their information in the notes field.
Your long-term water demand is unavailable until we receive population data for 2024 gallons per capita per day. What demand management practices do you plan to implement to reduce the per capita water demand (i.e. conduct regular water audits, implement a plumbing retrofit program, employ practices such as rainwater harvesting or reclaimed water)? If these practices are covered elsewhere in your plan, indicate where the practices are discussed here.
Are there other demand management practices you will implement to reduce your future supply needs?
What supplies other than the ones listed in future supplies are being considered to meet your future supply needs?
How does the water system intend to implement the demand management and supply planning components above?
Additional Information
Has this system participated in regional water supply or water use planning? Yes, WSACC contracted Black & Veatch for an updated Master Plan that was finalized in July 2024. The final document included an evaluation of existing water supplies and adequacy of those supplies relative to projected future demands. WSACC member jurisdictions have provided projected demand data and other data requests by Black & Veatch for this effort, and member jurisdictions received documentation from the Master Plan as part of their water supply planning efforts moving forward.
What major water supply reports or studies were used for planning? Master Plan
Please describe any other needs or issues regarding your water supply sources, any water system deficiencies or needed improvements (storage, treatment, etc.) or your ability to meet present and future water needs. Include both quantity and quality considerations, as well as financial, technical, managerial, permitting, and compliance issues: WSACC member jurisdictions manage any concerns related to overall number and adequacy of water supply sources withdrawal, treatment, and distribution. See associated responses from WSACC member jurisdictions.
The Division of Water Resources (DWR) provides the data contained within this
Local Water Supply Plan (LWSP) as a courtesy and service to our customers.
DWR staff does not field verify data. Neither DWR, nor any other party
involved in the preparation of this LWSP attests that the data is completely
free of errors and omissions. Furthermore, data users are cautioned that
LWSPs labeled PROVISIONAL have yet to be reviewed by DWR staff. Subsequent
review may result in significant revision. Questions regarding the accuracy
or limitations of usage of this data should be directed to the water system
and/or DWR.
|