|
The Division of Water Resources (DWR) provides the data contained within this
Local Water Supply Plan (LWSP) as a courtesy and service to our customers.
DWR staff does not field verify data. Neither DWR, nor any other party
involved in the preparation of this LWSP attests that the data is completely
free of errors and omissions. Furthermore, data users are cautioned that
LWSPs labeled PROVISIONAL have yet to be reviewed by DWR staff. Subsequent
review may result in significant revision. Questions regarding the accuracy
or limitations of usage of this data should be directed to the water system
and/or DWR.
1. System Information
Contact Information
Complete
| Water System Name: |
Lenoir |
|
PWSID: |
01-14-010 |
| Mailing Address: | P.O. Box 958
Lenoir, NC 28645 | Ownership: | Municipality |
| |
| Contact Person: | Kevin Matheson | Title: | Water Treatment Superintendent |
| Phone: | 828-757-4460 | Cell/Mobile: | 828-729-7001 |
| |
| Secondary Contact: | Jeff Church | | Phone: | 828-757-4459 |
| Mailing Address: | P.O. Box 958
Lenoir, NC 28645 | Cell/Mobile: | 828-312-2051 |
Distribution System
| Line Type |
Size Range (Inches) |
Estimated % of lines |
| Asbestos Cement |
6-16 |
48.00 % |
| Cast Iron |
4-12 |
30.00 % |
| Ductile Iron |
6-30 |
9.00 % |
| Galvanized Iron |
1.5-2 |
4.00 % |
| Other |
2-12 |
4.00 % |
| Polyvinyl Chloride |
2-12 |
5.00 % |
Programs
Water Conservation
We are currently in the final planning stages of an approved interconnection with the Town of Valdese, PWS 01-12-010. This interconnection once completed will provide means to supply or receive up to 4MGD. Target date for completion is 2029. 2. Water Use Information
Service Area
| Sub-Basin(s) | % of Service Population |
|---|
| Catawba River (03-1) | 100 % |
|
| County(s) | % of Service Population |
|---|
| Caldwell | 100 % |
|
Water Use by Type
| Type of Use |
Metered
Connections |
Metered
Average Use (MGD) |
Non-Metered
Connections |
Non-Metered
Estimated Use (MGD) |
| Residential |
9,218 |
1.2650 |
0 |
0.0000 |
| Commercial |
781 |
0.3450 |
0 |
0.0000 |
| Industrial |
64 |
1.0940 |
0 |
0.0000 |
| Institutional |
231 |
0.2471 |
0 |
0.0000 |
How much water was used for system processes (backwash, line cleaning, flushing, etc.)? 0.6030 MGD
Water Sales
| Purchaser |
PWSID |
Average
Daily Sold
(MGD) |
Days
Used |
Contract |
Required to
comply with water
use restrictions? |
Pipe Size(s)
(Inches) |
Use
Type |
| MGD |
Expiration |
Recurring |
| Baton WC |
01-14-025 |
0.5726 |
365 |
0.6000 |
2033 |
No |
Yes |
6 |
Regular |
| Caldwell County North |
01-14-048 |
0.0477 |
365 |
0.0800 |
2024 |
Yes |
Yes |
8 |
Regular |
| Caldwell County SE |
01-14-047 |
0.6764 |
365 |
0.8100 |
2024 |
Yes |
Yes |
12 |
Regular |
| Caldwell County West |
01-14-045 |
0.6299 |
365 |
0.8100 |
2024 |
Yes |
Yes |
12 |
Regular |
| Sawmills |
01-14-040 |
0.2541 |
365 |
0.3250 |
2032 |
Yes |
Yes |
6 |
Regular |
THE CONTRACT FROM THE CITY OF LENOIR ALLOWS A MAXIMUM OF 1.500 MGD TO BE DISTRIBUTED AS NEEDED BETWEEN THE COUNTY'S SOUTHEAST, WEST, AND NORTH SYSTEMS. HOWEVER, LENOIR INDICATES THERE ARE ALLOWANCES FOR THE CITY TO SUPPLY ADDITIONAL WATER ABOVE THE 1.500 MGD MAX AT A HIGHER RATE OF COST. ACCORDINGLY, A CUMULATIVE MAX OF 1.700 MGD IS SHOWN TO BE DISTRIBUTED AMONG THE 3 CALDWELL SYSTEMS SUCH THAT THE DEMAND TO SUPPLY RATIO DOES NOT EXCEED 80% AT ANY SYSTEM.
Per our contract with Lenoir is for .6000 MGD per day, however we can sell up to .7500 MGD per day at a higher rate. 3. Water Supply Sources
Monthly Withdrawals & Purchases
|
Average Daily
Use (MGD) |
Max Day
Use (MGD) |
|
Average Daily
Use (MGD) |
Max Day
Use (MGD) |
|
Average Daily
Use (MGD) |
Max Day
Use (MGD) |
| Jan |
5.7510 |
7.2210 |
May |
6.0580 |
6.8180 |
Sep |
6.1600 |
6.6530 |
| Feb |
5.6620 |
6.8050 |
Jun |
6.4570 |
7.4290 |
Oct |
6.3530 |
7.0580 |
| Mar |
5.5890 |
6.7440 |
Jul |
6.6760 |
7.1510 |
Nov |
5.7590 |
6.3400 |
| Apr |
5.7790 |
6.6000 |
Aug |
6.4740 |
6.9280 |
Dec |
5.6950 |
6.5020 |

Surface Water Sources
| Stream |
Reservoir |
Average Daily Withdrawal |
Maximum Day
Withdrawal (MGD) |
Available Raw
Water Supply |
Usable On-Stream
Raw Water Supply
Storage (MG) |
| MGD |
Days Used |
MGD |
* Qualifier |
| Catawba |
Lake Rhodhiss |
6.0340 |
365 |
7.4290 |
12.0000 |
T |
15,634.0000 |
* Qualifier: C=Contract Amount, SY20=20-year Safe Yield, SY50=50-year Safe Yield, F=20% of 7Q10 or other instream flow requirement, CUA=Capacity Use Area Permit
Surface Water Sources (continued)
| Stream |
Reservoir |
Drainage Area
(sq mi) |
Metered? |
Sub-Basin |
County |
Year
Offline |
Use
Type |
| Catawba |
Lake Rhodhiss |
1,090 |
Yes |
Catawba River (03-1) |
Caldwell |
|
Regular |
A very small maximum amount of 0.047 MGD could potentially be transferred from the Catawba basin to the Yadkin basin through our sales to Caldwell County. Water Treatment Plants
| Plant Name |
Permitted Capacity
(MGD) |
Is Raw Water Metered? |
Is Finished Water Ouput Metered? |
Source |
| Lenoir - Lake Rhodhiss WTP |
12.0000 |
Yes |
Yes |
Catawba River, Lake Rhodhiss |
4. Wastewater Information
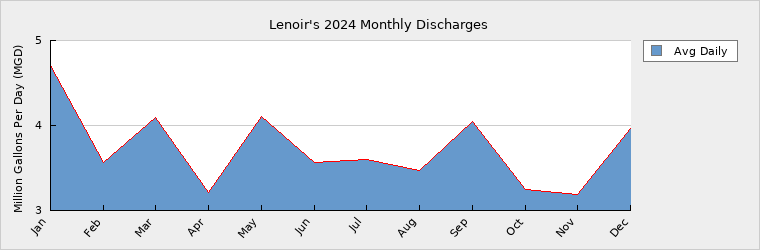
Monthly Discharges
|
Average Daily
Discharge (MGD) |
|
Average Daily
Discharge (MGD) |
|
Average Daily
Discharge (MGD) |
| Jan |
4.7080 |
May |
4.1060 |
Sep |
4.0480 |
| Feb |
3.5700 |
Jun |
3.5670 |
Oct |
3.2420 |
| Mar |
4.0990 |
Jul |
3.5990 |
Nov |
3.1850 |
| Apr |
3.2130 |
Aug |
3.4760 |
Dec |
3.9680 |
Wastewater Permits
| Permit Number |
Type |
Permitted Capacity
(MGD) |
Design Capacity
(MGD) |
Average Annual
Daily Discharge
(MGD) |
Maximum Day Discharge
(MGD) |
Receiving Stream |
Receiving Basin |
| NC0023736 |
WWTP |
2.0000 |
2.0000 |
1.3780 |
6.9360 |
Gunpowder Creek |
Catawba River (03-1) |
| NC0023981 |
WWTP |
6.0000 |
6.0000 |
2.2300 |
7.9740 |
Lower Creek |
Catawba River (03-1) |
| NC0044164 |
WTP |
3.0000 |
3.0000 |
0.1590 |
0.1950 |
Lake Rhodhiss |
Catawba River (03-1) |
| WQ0010059 |
CS |
0.0000 |
0.0000 |
0.0000 |
0.0000 |
Land Application |
Catawba River (03-1) |
Wastewater Interconnections
| Water System |
PWSID |
Type |
Average Daily Amount |
Contract
Maximum (MGD) |
| MGD |
Days Used |
| Town of Sawmills |
01-14-040 |
Receiving |
0.0647 |
365 |
0.2500 |
5. Planning
Projections
| |
2024 |
2030 |
2040 |
2050 |
2060 |
2070 |
| Year-Round Population |
21,922 |
22,185 |
22,650 |
23,126 |
23,612 |
24,104 |
| Seasonal Population |
0 |
0 |
0 |
0 |
0 |
0 |
| |
| Residential |
1.2650 |
1.2680 |
1.2911 |
1.3182 |
1.3459 |
1.3739 |
| Commercial |
0.3450 |
0.3490 |
0.3630 |
0.3780 |
0.3930 |
0.4090 |
| Industrial |
1.0940 |
1.0960 |
1.1400 |
1.1860 |
1.2330 |
1.2820 |
| Institutional |
0.2471 |
0.2970 |
0.3090 |
0.3210 |
0.3340 |
0.3470 |
| System Process |
0.6030 |
0.7300 |
0.7480 |
0.7490 |
0.7500 |
0.7530 |
| Unaccounted-for |
0.2887 |
0.3038 |
0.3128 |
0.3210 |
0.3295 |
0.3383 |
Future Supply Sources
| Source Name |
PWSID |
Source Type |
Additional Supply |
Year Online |
Year Offline |
Type |
| Town of Valdese |
01-12-010 |
Purchase |
4.0000 |
2029 |
|
Regular |
Demand v/s Percent of Supply
| |
2024 |
2030 |
2040 |
2050 |
2060 |
2070 |
| Surface Water Supply |
12.0000 |
12.0000 |
12.0000 |
12.0000 |
12.0000 |
12.0000 |
| Ground Water Supply |
0.0000 |
0.0000 |
0.0000 |
0.0000 |
0.0000 |
0.0000 |
| Purchases |
0.0000 |
0.0000 |
0.0000 |
0.0000 |
0.0000 |
0.0000 |
| Future Supplies |
4.0000 |
4.0000 |
4.0000 |
4.0000 |
4.0000 |
| Total Available Supply (MGD) |
12.0000 |
16.0000 |
16.0000 |
16.0000 |
16.0000 |
16.0000 |
| Service Area Demand |
3.8428 |
4.0438 |
4.1639 |
4.2732 |
4.3854 |
4.5032 |
| Sales |
2.1747 |
2.6250 |
2.0250 |
2.0250 |
2.0250 |
2.0250 |
| Future Sales |
0.0000 |
0.0000 |
0.0000 |
0.0000 |
0.0000 |
| Total Demand (MGD) |
6.0175 |
6.6688 |
6.1889 |
6.2982 |
6.4104 |
6.5282 |
| Demand as Percent of Supply |
50% |
42% |
39% |
39% |
40% |
41% |

The purpose of the above chart is to show a general indication of how the long-term per capita water demand changes over time. The per capita water demand may actually be different than indicated due to seasonal populations and the accuracy of data submitted. Water systems that have calculated long-term per capita water demand based on a methodology that produces different results may submit their information in the notes field.
Your long-term water demand is 58 gallons per capita per day. What demand management practices do you plan to implement to reduce the per capita water demand (i.e. conduct regular water audits, implement a plumbing retrofit program, employ practices such as rainwater harvesting or reclaimed water)? If these practices are covered elsewhere in your plan, indicate where the practices are discussed here.
No changes.
Are there other demand management practices you will implement to reduce your future supply needs? No changes.
What supplies other than the ones listed in future supplies are being considered to meet your future supply needs? None
How does the water system intend to implement the demand management and supply planning components above?
Additional Information
Has this system participated in regional water supply or water use planning? Yes, Catawba-Wateree Water Management Group
What major water supply reports or studies were used for planning? CWWMG master plan and Western Piedmont COG growth projections.
Please describe any other needs or issues regarding your water supply sources, any water system deficiencies or needed improvements (storage, treatment, etc.) or your ability to meet present and future water needs. Include both quantity and quality considerations, as well as financial, technical, managerial, permitting, and compliance issues: Will begin construction of another 0.150 MG elevated storage tank on Finley Avenue in 2025 to meet increased pressure needs for customers in that distribution zone. The interconnection plan with Valdese is proceeding and should be in place by 2029.
The Division of Water Resources (DWR) provides the data contained within this
Local Water Supply Plan (LWSP) as a courtesy and service to our customers.
DWR staff does not field verify data. Neither DWR, nor any other party
involved in the preparation of this LWSP attests that the data is completely
free of errors and omissions. Furthermore, data users are cautioned that
LWSPs labeled PROVISIONAL have yet to be reviewed by DWR staff. Subsequent
review may result in significant revision. Questions regarding the accuracy
or limitations of usage of this data should be directed to the water system
and/or DWR.
|