|
The Division of Water Resources (DWR) provides the data contained within this
Local Water Supply Plan (LWSP) as a courtesy and service to our customers.
DWR staff does not field verify data. Neither DWR, nor any other party
involved in the preparation of this LWSP attests that the data is completely
free of errors and omissions. Furthermore, data users are cautioned that
LWSPs labeled PROVISIONAL have yet to be reviewed by DWR staff. Subsequent
review may result in significant revision. Questions regarding the accuracy
or limitations of usage of this data should be directed to the water system
and/or DWR.
1. System Information
Contact Information
Complete
| Water System Name: |
Granite Falls |
|
PWSID: |
01-14-030 |
| Mailing Address: | PO Drawer 10
Granite Falls, NC 28630 | Ownership: | Municipality |
| |
| Contact Person: | Randy Smith | Title: | Water Resources Director |
| Phone: | 828-396-2989 | Cell/Mobile: | -- |
Distribution System
| Line Type |
Size Range (Inches) |
Estimated % of lines |
| Asbestos Cement |
8-12 |
8.67 % |
| Cast Iron |
6-12 |
34.96 % |
| Ductile Iron |
6-12 |
22.00 % |
| Galvanized Iron |
1-2 |
2.58 % |
| Polyvinyl Chloride |
2-12 |
31.79 % |
System maps are updated as needed to reflect the most current system properties. The overall distribution system pressure has been adequate. Altitude valves at Falls Ave and Pinewood Tanks were replaced in 2022. The Town is completing an awarded AIA Grant for the Water System which will be used to build a new hydrological model for the Town's distribution system. This study will allow us to analyze the effects of current and future projects on our distribution system. The Town is also in the midst a 5 million dollar CDBG Block Grant to improve water infrastructure over the next few years. There is also a DOT project that will be replacing water infrastructure along Pinewood Road that has started. Programs
We manually read meters monthly. During this process the meter readers check readings for unusual usage. The customer service staff enters the reading manually, and checks again for unusual usage. If unusual usage is detected, the customer service staff creates reread reports which are fulfilled by meter readers. The customer service staff also reviews bills for higher than usual bills to determine if usage is unusual. Customer service staff will contact customers if unusual usage is detected. We also continuously monitor our tank levels for any abnormalities with daily distribution. Staff utilizes a leak detection listening device to find main and service line leaks. Water Conservation
The interconnection is not in use, as it will only supply a fraction of the demand needed. A reclaimed water study was prepared by The Wooten Company for the Town in 2011 and evaluated the potential for implementing reclaimed water usage. 2. Water Use Information
Service Area
| Sub-Basin(s) | % of Service Population |
|---|
| Catawba River (03-1) | 100 % |
|
| County(s) | % of Service Population |
|---|
| Caldwell | 100 % |
|
Water Use by Type
| Type of Use |
Metered
Connections |
Metered
Average Use (MGD) |
Non-Metered
Connections |
Non-Metered
Estimated Use (MGD) |
| Residential |
2,394 |
0.2840 |
0 |
0.0000 |
| Commercial |
308 |
0.0960 |
0 |
0.0000 |
| Industrial |
1 |
0.0070 |
0 |
0.0000 |
| Institutional |
21 |
0.1320 |
3 |
0.0008 |
How much water was used for system processes (backwash, line cleaning, flushing, etc.)? 0.0394 MGD
Water usages lumped into the system process was fire fighting water, flushing of fire hydrants, sewer jetting, and other process water usage at the WTP that doesn't go to the distribution system (backwash water, draining clearwells, running TrackVac in settling basins, laboratory sample pumps, etc). Efforts are being made to replace the existing older service lines to reduce service line breakages and to also reduce the amount of water lost from the system.
We have changed many of our non-metered municipal connections to metered connections, and we have added additional meters at some locations to monitor by specific usage. Water Sales
| Purchaser |
PWSID |
Average
Daily Sold
(MGD) |
Days
Used |
Contract |
Required to
comply with water
use restrictions? |
Pipe Size(s)
(Inches) |
Use
Type |
| MGD |
Expiration |
Recurring |
| Caldwell County S |
01-14-047 |
0.3380 |
366 |
0.5500 |
2036 |
Yes |
Yes |
12 |
Regular |
| Hickory |
01-18-010 |
0.0720 |
366 |
|
2023 |
Yes |
Yes |
12 |
Regular |
| Rhodhiss |
01-14-035 |
0.0310 |
366 |
0.0500 |
2034 |
Yes |
Yes |
10 |
Regular |
A review of the most recent contract between the Town of Granite Falls and the City of Hickory found that there was no contract volume listed. 3. Water Supply Sources
Monthly Withdrawals & Purchases
|
Average Daily
Use (MGD) |
Max Day
Use (MGD) |
|
Average Daily
Use (MGD) |
Max Day
Use (MGD) |
|
Average Daily
Use (MGD) |
Max Day
Use (MGD) |
| Jan |
0.9670 |
|
May |
1.0890 |
|
Sep |
1.1850 |
|
| Feb |
0.9470 |
|
Jun |
0.9730 |
|
Oct |
1.2000 |
|
| Mar |
0.9450 |
|
Jul |
1.1920 |
|
Nov |
1.0740 |
|
| Apr |
1.0150 |
|
Aug |
1.1800 |
|
Dec |
1.0900 |
|
Above are numbers from our raw water withdrawal. 
Surface Water Sources
| Stream |
Reservoir |
Average Daily Withdrawal |
Maximum Day
Withdrawal (MGD) |
Available Raw
Water Supply |
Usable On-Stream
Raw Water Supply
Storage (MG) |
| MGD |
Days Used |
MGD |
* Qualifier |
| Catawba River |
Lake Rhodhiss |
1.0720 |
366 |
0.0000 |
2.5000 |
T |
23,800.0000 |
* Qualifier: C=Contract Amount, SY20=20-year Safe Yield, SY50=50-year Safe Yield, F=20% of 7Q10 or other instream flow requirement, CUA=Capacity Use Area Permit
Surface Water Sources (continued)
| Stream |
Reservoir |
Drainage Area
(sq mi) |
Metered? |
Sub-Basin |
County |
Year
Offline |
Use
Type |
| Catawba River |
Lake Rhodhiss |
1,090 |
Yes |
Catawba River (03-1) |
Caldwell |
|
Regular |
Water Purchases From Other Systems
| Seller |
PWSID |
Average
Daily Purchased
(MGD) |
Days
Used |
Contract |
Required to
comply with water
use restrictions? |
Pipe Size(s)
(Inches) |
Use
Type |
| MGD |
Expiration |
Recurring |
| Caldwell County Southeast |
01-14-047 |
0.0000 |
0 |
0.0000 |
|
Yes |
Yes |
8 |
Emergency |
No water was purchased from Caldwell County Southeast during 2024.
Caldwell County Southeast is providing water to Granite Falls residents in Granite Falls Town Limits with water purchased from Granite Falls. The water purchased is not conveyed using an emergency connection. Water Treatment Plants
| Plant Name |
Permitted Capacity
(MGD) |
Is Raw Water Metered? |
Is Finished Water Ouput Metered? |
Source |
| Granite Falls WTP |
2.5000 |
Yes |
Yes |
Lake Rhodhiss (Catawba River) |
4. Wastewater Information
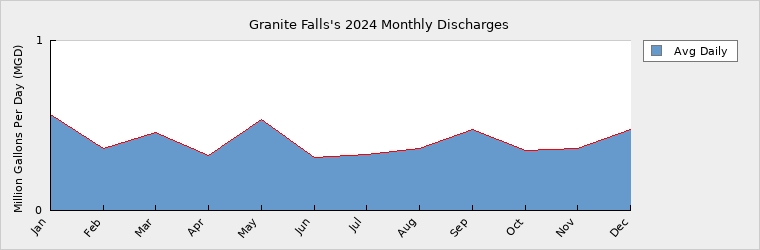
Monthly Discharges
|
Average Daily
Discharge (MGD) |
|
Average Daily
Discharge (MGD) |
|
Average Daily
Discharge (MGD) |
| Jan |
0.5660 |
May |
0.5380 |
Sep |
0.4780 |
| Feb |
0.3620 |
Jun |
0.3140 |
Oct |
0.3550 |
| Mar |
0.4600 |
Jul |
0.3300 |
Nov |
0.3650 |
| Apr |
0.3250 |
Aug |
0.3650 |
Dec |
0.4740 |
Wastewater Permits
| Permit Number |
Type |
Permitted Capacity
(MGD) |
Design Capacity
(MGD) |
Average Annual
Daily Discharge
(MGD) |
Maximum Day Discharge
(MGD) |
Receiving Stream |
Receiving Basin |
| NC0021890 |
WWTP |
0.9000 |
0.7500 |
0.4100 |
2.0000 |
Gunpowder Creek |
Catawba River (03-1) |
| NCG590005 |
WTP |
0.0630 |
0.0630 |
0.0000 |
0.1000 |
Lake Rhodhiss |
Catawba River (03-1) |
5. Planning
Projections
| |
2024 |
2030 |
2040 |
2050 |
2060 |
2070 |
| Year-Round Population |
7,318 |
7,505 |
7,887 |
8,290 |
8,712 |
9,157 |
| Seasonal Population |
0 |
0 |
0 |
0 |
0 |
0 |
| |
| Residential |
0.2840 |
0.2912 |
0.3061 |
0.3217 |
0.3381 |
0.3554 |
| Commercial |
0.0960 |
0.0984 |
0.1035 |
0.1087 |
0.1143 |
0.1201 |
| Industrial |
0.0070 |
0.0072 |
0.0075 |
0.0079 |
0.0083 |
0.0088 |
| Institutional |
0.1328 |
0.1354 |
0.1423 |
0.1495 |
0.1572 |
0.1652 |
| System Process |
0.0394 |
0.0404 |
0.0425 |
0.0446 |
0.0469 |
0.0493 |
| Unaccounted-for |
0.0718 |
0.0735 |
0.0773 |
0.0812 |
0.0854 |
0.0897 |
The population projections were made by calculating the population for the service area, not the population of the Town. The population for the service area was obtained from PWSS (https://www.pwss.enr.state.nc.us/NCDWW/JSP/WaterSystemDetail.jsp?tinwsys_is_number=326&tinwsys_st_code=NC&wsnumber=NC0114030).
The population projections were based on the 5.1% population increase in Granite Falls from the 2010 to 2020 Census. While Caldwell County as a whole has seen a 2% decrease in population, most of our service area is in the Town Limits and the area around Granite Falls is growing at a similar rate to the Town Limits. The extended ranges were kept at a constant rate through 2070.
The unaccounted for usage has also been projected out at the same 5.1% increase. The Town works to repair water leaks as quickly as possible to reduce the volume of water lost as a result of leaks and hopes to reduce unaccounted for water in the future. Demand v/s Percent of Supply
| |
2024 |
2030 |
2040 |
2050 |
2060 |
2070 |
| Surface Water Supply |
2.5000 |
2.5000 |
2.5000 |
2.5000 |
2.5000 |
2.5000 |
| Ground Water Supply |
0.0000 |
0.0000 |
0.0000 |
0.0000 |
0.0000 |
0.0000 |
| Purchases |
0.0000 |
0.0000 |
0.0000 |
0.0000 |
0.0000 |
0.0000 |
| Future Supplies |
0.0000 |
0.0000 |
0.0000 |
0.0000 |
0.0000 |
| Total Available Supply (MGD) |
2.5000 |
2.5000 |
2.5000 |
2.5000 |
2.5000 |
2.5000 |
| Service Area Demand |
0.6310 |
0.6461 |
0.6792 |
0.7136 |
0.7502 |
0.7885 |
| Sales |
0.4410 |
0.6720 |
0.6720 |
0.6720 |
0.6720 |
0.6720 |
| Future Sales |
0.0000 |
0.0000 |
0.0000 |
0.0000 |
0.0000 |
| Total Demand (MGD) |
1.0720 |
1.3181 |
1.3512 |
1.3856 |
1.4222 |
1.4605 |
| Demand as Percent of Supply |
43% |
53% |
54% |
55% |
57% |
58% |

The purpose of the above chart is to show a general indication of how the long-term per capita water demand changes over time. The per capita water demand may actually be different than indicated due to seasonal populations and the accuracy of data submitted. Water systems that have calculated long-term per capita water demand based on a methodology that produces different results may submit their information in the notes field.
Your long-term water demand is 39 gallons per capita per day. What demand management practices do you plan to implement to reduce the per capita water demand (i.e. conduct regular water audits, implement a plumbing retrofit program, employ practices such as rainwater harvesting or reclaimed water)? If these practices are covered elsewhere in your plan, indicate where the practices are discussed here.
No Changes
Are there other demand management practices you will implement to reduce your future supply needs?
What supplies other than the ones listed in future supplies are being considered to meet your future supply needs?
How does the water system intend to implement the demand management and supply planning components above?
Additional Information
Has this system participated in regional water supply or water use planning? Yes, Yes, The Town has representatives on the Catawba River Study Committee and Drought Management Advisory Group. The Town is also a member of the Catawba-Wateree Management Group, which was established as a part of the Duke Energy re-licensing of the Catawba River.
What major water supply reports or studies were used for planning? A Water Treatment Study dated October 2009 was commissioned by the Town. This is a primary study referenced for upcoming improvements to the System. Additionally, water system improvements are evaluated annually by water and wastewater staff for inclusion into the Capital Improvement Plan. Additional studies will be performed as the needs or conditions change within the System.
Please describe any other needs or issues regarding your water supply sources, any water system deficiencies or needed improvements (storage, treatment, etc.) or your ability to meet present and future water needs. Include both quantity and quality considerations, as well as financial, technical, managerial, permitting, and compliance issues: Additional storage was addressed with the construction of a 1.0 MG elevated storage tank in 2012.
The Division of Water Resources (DWR) provides the data contained within this
Local Water Supply Plan (LWSP) as a courtesy and service to our customers.
DWR staff does not field verify data. Neither DWR, nor any other party
involved in the preparation of this LWSP attests that the data is completely
free of errors and omissions. Furthermore, data users are cautioned that
LWSPs labeled PROVISIONAL have yet to be reviewed by DWR staff. Subsequent
review may result in significant revision. Questions regarding the accuracy
or limitations of usage of this data should be directed to the water system
and/or DWR.
|