|
The Division of Water Resources (DWR) provides the data contained within this
Local Water Supply Plan (LWSP) as a courtesy and service to our customers.
DWR staff does not field verify data. Neither DWR, nor any other party
involved in the preparation of this LWSP attests that the data is completely
free of errors and omissions. Furthermore, data users are cautioned that
LWSPs labeled PROVISIONAL have yet to be reviewed by DWR staff. Subsequent
review may result in significant revision. Questions regarding the accuracy
or limitations of usage of this data should be directed to the water system
and/or DWR.
1. System Information
Contact Information
Complete
| Water System Name: |
Newton |
|
PWSID: |
01-18-015 |
| Mailing Address: | P.O. Box 550
Newton, NC 28658 | Ownership: | Municipality |
| |
| Contact Person: | Dennis Falder Jr. | Title: | Water Resources Director |
| Phone: | 828-695-4298 | Cell/Mobile: | -- |
Distribution System
| Line Type |
Size Range (Inches) |
Estimated % of lines |
| Asbestos Cement |
4-12 |
0.00 % |
| Cast Iron |
4-16 |
8.50 % |
| Ductile Iron |
4-20 |
48.50 % |
| Galvanized Iron |
2 |
2.00 % |
| Polyvinyl Chloride |
2-12 |
41.00 % |
Watermain on W. 15th between N. Frye and N. Main has inadequate pressure. Construction is scheduled to begin June 2025. Programs
Water Conservation
2. Water Use Information
Service Area
| Sub-Basin(s) | % of Service Population |
|---|
| South Fork Catawba River (03-2) | 99 % |
| Catawba River (03-1) | 1 % |
|
| County(s) | % of Service Population |
|---|
| Catawba | 100 % |
|
Water Use by Type
| Type of Use |
Metered
Connections |
Metered
Average Use (MGD) |
Non-Metered
Connections |
Non-Metered
Estimated Use (MGD) |
| Residential |
6,320 |
0.6828 |
0 |
0.0000 |
| Commercial |
664 |
0.6027 |
0 |
0.0000 |
| Industrial |
91 |
0.0765 |
0 |
0.0000 |
| Institutional |
18 |
0.0154 |
0 |
0.0000 |
How much water was used for system processes (backwash, line cleaning, flushing, etc.)? 0.2517 MGD
System process includes water used during fire hydrant use, maintenance, and fire fighting operations as estimated by the fire chief and bulk water sales to industrial and residential developers for dust control. One industrial development currently under construction is using 100,000 per day. Water Sales
| Purchaser |
PWSID |
Average
Daily Sold
(MGD) |
Days
Used |
Contract |
Required to
comply with water
use restrictions? |
Pipe Size(s)
(Inches) |
Use
Type |
| MGD |
Expiration |
Recurring |
| Catawba |
01-18-040 |
0.0000 |
0 |
0.0000 |
|
No |
Yes |
12 |
Emergency |
| Energy United Water Corporation |
01-02-015 |
2.0635 |
366 |
2.5000 |
2036 |
Yes |
Yes |
20 |
Regular |
| Hickory |
01-18-010 |
0.0000 |
0 |
0.0000 |
|
No |
No |
12 |
Emergency |
| Maiden |
01-18-030 |
0.0023 |
366 |
0.0083 |
2031 |
No |
Yes |
12 |
Regular |
3. Water Supply Sources
Monthly Withdrawals & Purchases
|
Average Daily
Use (MGD) |
Max Day
Use (MGD) |
|
Average Daily
Use (MGD) |
Max Day
Use (MGD) |
|
Average Daily
Use (MGD) |
Max Day
Use (MGD) |
| Jan |
2.8696 |
4.4070 |
May |
4.8563 |
7.8060 |
Sep |
4.0946 |
7.8240 |
| Feb |
2.8593 |
3.6880 |
Jun |
5.1288 |
8.2850 |
Oct |
4.9966 |
8.3610 |
| Mar |
3.7411 |
6.8340 |
Jul |
4.6965 |
8.7850 |
Nov |
5.0556 |
8.6570 |
| Apr |
3.6748 |
7.6670 |
Aug |
4.6966 |
8.9050 |
Dec |
4.3358 |
7.9730 |

Surface Water Sources
| Stream |
Reservoir |
Average Daily Withdrawal |
Maximum Day
Withdrawal (MGD) |
Available Raw
Water Supply |
Usable On-Stream
Raw Water Supply
Storage (MG) |
| MGD |
Days Used |
MGD |
* Qualifier |
| Jacobs Fork River |
City Lake Reservior |
4.1225 |
366 |
5.9510 |
8.0000 |
T |
15.0000 |
| Unnamed Tributaries to Reservo |
City Lake Reservior |
0.2500 |
187 |
0.2500 |
0.6000 |
T |
0.0000 |
* Qualifier: C=Contract Amount, SY20=20-year Safe Yield, SY50=50-year Safe Yield, F=20% of 7Q10 or other instream flow requirement, CUA=Capacity Use Area Permit
Surface Water Sources (continued)
| Stream |
Reservoir |
Drainage Area
(sq mi) |
Metered? |
Sub-Basin |
County |
Year
Offline |
Use
Type |
| Jacobs Fork River |
City Lake Reservior |
96 |
Yes |
South Fork Catawba River (03-2) |
Catawba |
|
Regular |
| Unnamed Tributaries to Reservo |
City Lake Reservior |
3 |
No |
Catawba River (03-1) |
Catawba |
|
Regular |
The sales to Energy Unites is a transfer from 3-2 to 3-1. Water Purchases From Other Systems
| Seller |
PWSID |
Average
Daily Purchased
(MGD) |
Days
Used |
Contract |
Required to
comply with water
use restrictions? |
Pipe Size(s)
(Inches) |
Use
Type |
| MGD |
Expiration |
Recurring |
| Hickory |
01-18-010 |
0.0000 |
0 |
0.0000 |
|
No |
No |
12 |
Emergency |
Water Treatment Plants
| Plant Name |
Permitted Capacity
(MGD) |
Is Raw Water Metered? |
Is Finished Water Ouput Metered? |
Source |
| Newton Water Plant |
8.0000 |
Yes |
Yes |
Jacobs Fork River |
4. Wastewater Information
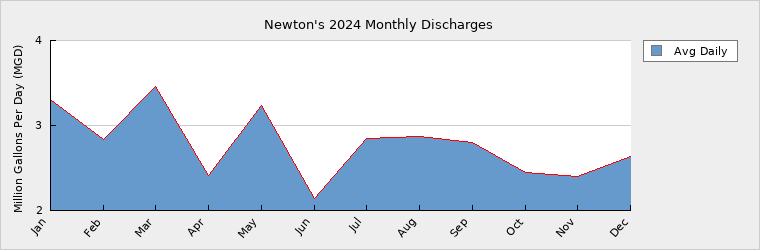
Monthly Discharges
|
Average Daily
Discharge (MGD) |
|
Average Daily
Discharge (MGD) |
|
Average Daily
Discharge (MGD) |
| Jan |
3.3000 |
May |
3.2300 |
Sep |
2.8000 |
| Feb |
2.8300 |
Jun |
2.1400 |
Oct |
2.4500 |
| Mar |
3.4600 |
Jul |
2.8500 |
Nov |
2.4000 |
| Apr |
2.4100 |
Aug |
2.8700 |
Dec |
2.6300 |
Ph I of the WWTP replacement is under contract and expected to be completed by Dec 2027. This phase replaces the influent PS, grit removal and lime system, as well as some electrical lines and other small items. Phase two, which includes increases in primary, secondary, and tertiary treatment, filter replacement, and solid waste handling and storage, has been design, but is awaiting funding. Wastewater Permits
| Permit Number |
Type |
Permitted Capacity
(MGD) |
Design Capacity
(MGD) |
Average Annual
Daily Discharge
(MGD) |
Maximum Day Discharge
(MGD) |
Receiving Stream |
Receiving Basin |
| NC0036196 |
WWTP |
5.0000 |
7.5000 |
2.7800 |
6.3800 |
Clark Creek |
South Fork Catawba River (03-2) |
Wastewater Interconnections
| Water System |
PWSID |
Type |
Average Daily Amount |
Contract
Maximum (MGD) |
| MGD |
Days Used |
| City of Conover |
01-18-020 |
Receiving |
0.3380 |
366 |
1.0500 |
5. Planning
Projections
| |
2024 |
2030 |
2040 |
2050 |
2060 |
2070 |
| Year-Round Population |
17,744 |
18,188 |
18,733 |
19,295 |
19,874 |
20,470 |
| Seasonal Population |
0 |
0 |
0 |
0 |
0 |
0 |
| |
| Residential |
0.6828 |
0.6994 |
0.7204 |
0.7420 |
0.7642 |
0.7871 |
| Commercial |
0.6027 |
0.5462 |
0.5626 |
0.5795 |
0.5939 |
0.6148 |
| Industrial |
0.0765 |
0.1000 |
0.1030 |
0.1061 |
0.1093 |
0.1126 |
| Institutional |
0.0154 |
0.0185 |
0.0191 |
0.0197 |
0.0203 |
0.0209 |
| System Process |
0.2517 |
0.2542 |
0.2568 |
0.2593 |
0.2619 |
0.2645 |
| Unaccounted-for |
0.5553 |
0.5516 |
0.5665 |
0.5817 |
0.5964 |
0.6135 |
Demand v/s Percent of Supply
| |
2024 |
2030 |
2040 |
2050 |
2060 |
2070 |
| Surface Water Supply |
8.6000 |
8.6000 |
8.6000 |
8.6000 |
8.6000 |
8.6000 |
| Ground Water Supply |
0.0000 |
0.0000 |
0.0000 |
0.0000 |
0.0000 |
0.0000 |
| Purchases |
0.0000 |
0.0000 |
0.0000 |
0.0000 |
0.0000 |
0.0000 |
| Future Supplies |
0.0000 |
0.0000 |
0.0000 |
0.0000 |
0.0000 |
| Total Available Supply (MGD) |
8.6000 |
8.6000 |
8.6000 |
8.6000 |
8.6000 |
8.6000 |
| Service Area Demand |
2.1844 |
2.1699 |
2.2284 |
2.2883 |
2.3460 |
2.4134 |
| Sales |
2.0658 |
2.5083 |
2.5000 |
2.5000 |
2.5000 |
2.5000 |
| Future Sales |
0.0000 |
0.0000 |
0.0000 |
0.0000 |
0.0000 |
| Total Demand (MGD) |
4.2502 |
4.6782 |
4.7284 |
4.7883 |
4.8460 |
4.9134 |
| Demand as Percent of Supply |
49% |
54% |
55% |
56% |
56% |
57% |

The purpose of the above chart is to show a general indication of how the long-term per capita water demand changes over time. The per capita water demand may actually be different than indicated due to seasonal populations and the accuracy of data submitted. Water systems that have calculated long-term per capita water demand based on a methodology that produces different results may submit their information in the notes field.
Your long-term water demand is 38 gallons per capita per day. What demand management practices do you plan to implement to reduce the per capita water demand (i.e. conduct regular water audits, implement a plumbing retrofit program, employ practices such as rainwater harvesting or reclaimed water)? If these practices are covered elsewhere in your plan, indicate where the practices are discussed here.
In FY 2016, we changed switched from traditional meters to AMI meters. This allows us to monitor both continuous usage (for leaks on the customer side) and note specific properties that show significant increases in water usage. This information allows use to contact customers to alert to them to their water usage trends and discuss water use reduction in a targeted manner. The AMI system will also allow us to get away from a decreasing block schedule in the future, which will encourage water conservation by the largest users.
Are there other demand management practices you will implement to reduce your future supply needs? none at this time
What supplies other than the ones listed in future supplies are being considered to meet your future supply needs? none at this time
How does the water system intend to implement the demand management and supply planning components above? N/A
Additional Information
Has this system participated in regional water supply or water use planning? Yes, Yes, Newton participates in CW-DMAG
What major water supply reports or studies were used for planning? CW-DMAG reports and studies.
Please describe any other needs or issues regarding your water supply sources, any water system deficiencies or needed improvements (storage, treatment, etc.) or your ability to meet present and future water needs. Include both quantity and quality considerations, as well as financial, technical, managerial, permitting, and compliance issues:
The Division of Water Resources (DWR) provides the data contained within this
Local Water Supply Plan (LWSP) as a courtesy and service to our customers.
DWR staff does not field verify data. Neither DWR, nor any other party
involved in the preparation of this LWSP attests that the data is completely
free of errors and omissions. Furthermore, data users are cautioned that
LWSPs labeled PROVISIONAL have yet to be reviewed by DWR staff. Subsequent
review may result in significant revision. Questions regarding the accuracy
or limitations of usage of this data should be directed to the water system
and/or DWR.
|