|
The Division of Water Resources (DWR) provides the data contained within this
Local Water Supply Plan (LWSP) as a courtesy and service to our customers.
DWR staff does not field verify data. Neither DWR, nor any other party
involved in the preparation of this LWSP attests that the data is completely
free of errors and omissions. Furthermore, data users are cautioned that
LWSPs labeled PROVISIONAL have yet to be reviewed by DWR staff. Subsequent
review may result in significant revision. Questions regarding the accuracy
or limitations of usage of this data should be directed to the water system
and/or DWR.
1. System Information
Contact Information
Complete
| Water System Name: |
Conover |
|
PWSID: |
01-18-020 |
| Mailing Address: | P.O. Box 549
Conover, NC 28613 | Ownership: | Municipality |
| |
| Contact Person: | Brian Bradshaw | Title: | Utilities Director |
| Phone: | 828-464-4808 | Cell/Mobile: | 828-578-0761 |
Distribution System
| Line Type |
Size Range (Inches) |
Estimated % of lines |
| Asbestos Cement |
6-8 |
1.00 % |
| Cast Iron |
6-8 |
20.00 % |
| Ductile Iron |
6-20 |
53.00 % |
| Galvanized Iron |
2 |
1.00 % |
| Polyvinyl Chloride |
2-12 |
25.00 % |
Programs
Water Conservation
2. Water Use Information
Service Area
| Sub-Basin(s) | % of Service Population |
|---|
| Catawba River (03-1) | 59 % |
| South Fork Catawba River (03-2) | 41 % |
|
| County(s) | % of Service Population |
|---|
| Catawba | 100 % |
|
Water Use by Type
| Type of Use |
Metered
Connections |
Metered
Average Use (MGD) |
Non-Metered
Connections |
Non-Metered
Estimated Use (MGD) |
| Residential |
5,659 |
0.7340 |
0 |
0.0000 |
| Commercial |
362 |
0.1760 |
0 |
0.0000 |
| Industrial |
164 |
0.1850 |
0 |
0.0000 |
| Institutional |
106 |
0.1160 |
0 |
0.0000 |
How much water was used for system processes (backwash, line cleaning, flushing, etc.)? 0.0360 MGD
Water Sales
| Purchaser |
PWSID |
Average
Daily Sold
(MGD) |
Days
Used |
Contract |
Required to
comply with water
use restrictions? |
Pipe Size(s)
(Inches) |
Use
Type |
| MGD |
Expiration |
Recurring |
| Claremont |
01-18-035 |
0.3610 |
366 |
0.5800 |
2019 |
Yes |
Yes |
12,8 |
Regular |
3. Water Supply Sources
Monthly Withdrawals & Purchases
|
Average Daily
Use (MGD) |
Max Day
Use (MGD) |
|
Average Daily
Use (MGD) |
Max Day
Use (MGD) |
|
Average Daily
Use (MGD) |
Max Day
Use (MGD) |
| Jan |
1.7450 |
2.1930 |
May |
1.8940 |
2.7210 |
Sep |
1.9650 |
2.3490 |
| Feb |
1.6410 |
1.7860 |
Jun |
2.0870 |
2.6440 |
Oct |
1.9440 |
2.3240 |
| Mar |
1.5700 |
1.7810 |
Jul |
2.0760 |
2.4820 |
Nov |
1.7030 |
2.0840 |
| Apr |
1.6750 |
2.1000 |
Aug |
1.9370 |
2.3630 |
Dec |
1.5690 |
2.0010 |
This includes the pass through to Southeastern Catawba County. 
Water Purchases From Other Systems
| Seller |
PWSID |
Average
Daily Purchased
(MGD) |
Days
Used |
Contract |
Required to
comply with water
use restrictions? |
Pipe Size(s)
(Inches) |
Use
Type |
| MGD |
Expiration |
Recurring |
| Hickory |
01-18-010 |
1.8730 |
366 |
3.0000 |
2040 |
Yes |
Yes |
4@ 12 |
Regular |
4. Wastewater Information
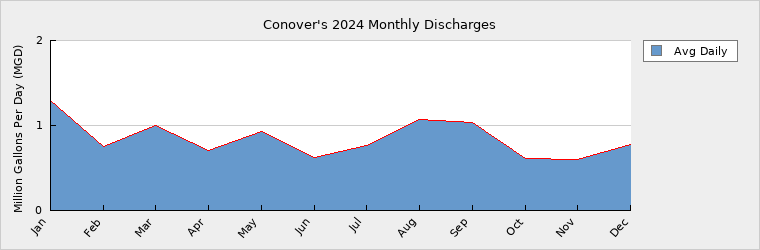
Monthly Discharges
|
Average Daily
Discharge (MGD) |
|
Average Daily
Discharge (MGD) |
|
Average Daily
Discharge (MGD) |
| Jan |
1.2910 |
May |
0.9350 |
Sep |
1.0370 |
| Feb |
0.7570 |
Jun |
0.6180 |
Oct |
0.6140 |
| Mar |
0.9980 |
Jul |
0.7590 |
Nov |
0.5950 |
| Apr |
0.7000 |
Aug |
1.0730 |
Dec |
0.7740 |
August 27, 2023 the city of Hickory diverted 92% of their flow that they were sending Conover to their Henry Fork WWTP. In 2024 they diverted the other 8% of their flow to the Henry Fork WWTP. Conover no longer receives wastewater from the City of Hickory. Wastewater Permits
| Permit Number |
Type |
Permitted Capacity
(MGD) |
Design Capacity
(MGD) |
Average Annual
Daily Discharge
(MGD) |
Maximum Day Discharge
(MGD) |
Receiving Stream |
Receiving Basin |
| NC 0024279 P001 |
WWTP |
0.3000 |
0.3000 |
0.0000 |
0.0000 |
McLin Creek |
Catawba River (03-1) |
| NC 0024279 P002 |
WWTP |
0.3000 |
0.3000 |
0.0000 |
0.0000 |
McLin Creek |
Catawba River (03-1) |
| NC0024252 |
WWTP |
1.5000 |
1.5000 |
0.5080 |
3.6000 |
Lyle Creek |
Catawba River (03-1) |
Wastewater Interconnections
| Water System |
PWSID |
Type |
Average Daily Amount |
Contract
Maximum (MGD) |
| MGD |
Days Used |
| Newton |
01-18-015 |
Discharging |
0.3380 |
366 |
1.0500 |
| City of Hickory |
01-18-010 |
Receiving |
0.0000 |
0 |
0.6250 |
5. Planning
Projections
| |
2024 |
2030 |
2040 |
2050 |
2060 |
2070 |
| Year-Round Population |
15,979 |
17,226 |
18,776 |
20,090 |
21,095 |
22,150 |
| Seasonal Population |
0 |
0 |
0 |
0 |
0 |
0 |
| |
| Residential |
0.7340 |
0.7770 |
0.8410 |
0.9000 |
0.9450 |
0.9920 |
| Commercial |
0.1760 |
0.2090 |
0.2280 |
0.2440 |
0.2560 |
0.2690 |
| Industrial |
0.1850 |
0.1980 |
0.2160 |
0.2310 |
0.2430 |
0.2550 |
| Institutional |
0.1160 |
0.1180 |
0.1215 |
0.1252 |
0.1289 |
0.1328 |
| System Process |
0.0360 |
0.0350 |
0.0369 |
0.0398 |
0.0408 |
0.0430 |
| Unaccounted-for |
0.2650 |
0.2601 |
0.2808 |
0.2930 |
0.3089 |
0.3153 |
Demand v/s Percent of Supply
| |
2024 |
2030 |
2040 |
2050 |
2060 |
2070 |
| Surface Water Supply |
0.0000 |
0.0000 |
0.0000 |
0.0000 |
0.0000 |
0.0000 |
| Ground Water Supply |
0.0000 |
0.0000 |
0.0000 |
0.0000 |
0.0000 |
0.0000 |
| Purchases |
3.0000 |
3.0000 |
3.0000 |
3.0000 |
3.0000 |
3.0000 |
| Future Supplies |
0.0000 |
0.0000 |
0.0000 |
0.0000 |
0.0000 |
| Total Available Supply (MGD) |
3.0000 |
3.0000 |
3.0000 |
3.0000 |
3.0000 |
3.0000 |
| Service Area Demand |
1.5120 |
1.5971 |
1.7242 |
1.8330 |
1.9226 |
2.0071 |
| Sales |
0.3610 |
0.5800 |
0.5800 |
0.5800 |
0.5800 |
0.5800 |
| Future Sales |
0.0000 |
0.0000 |
0.0000 |
0.0000 |
0.0000 |
| Total Demand (MGD) |
1.8730 |
2.1771 |
2.3042 |
2.4130 |
2.5026 |
2.5871 |
| Demand as Percent of Supply |
62% |
73% |
77% |
80% |
83% |
86% |

The purpose of the above chart is to show a general indication of how the long-term per capita water demand changes over time. The per capita water demand may actually be different than indicated due to seasonal populations and the accuracy of data submitted. Water systems that have calculated long-term per capita water demand based on a methodology that produces different results may submit their information in the notes field.
Your long-term water demand is 46 gallons per capita per day. What demand management practices do you plan to implement to reduce the per capita water demand (i.e. conduct regular water audits, implement a plumbing retrofit program, employ practices such as rainwater harvesting or reclaimed water)? If these practices are covered elsewhere in your plan, indicate where the practices are discussed here.
No Changes
Are there other demand management practices you will implement to reduce your future supply needs? We currently continue to update our current AMR system and we are looking to implement a AMI system to allow us to be proactive in reducing customer usage by detecting customer leaks earlier. We are notifying customers that they may have leaks and giving them suggestions on where to look for the leak.
What supplies other than the ones listed in future supplies are being considered to meet your future supply needs? We have the ability to negotiate the purchase of additional 2 to 3 MGD capacity in the City of Hickory Water Treatment Facility.
How does the water system intend to implement the demand management and supply planning components above? We are looking to upgrade our existing AMR system to an AMI system. We have developed procedures to notify customers that they may have a leak. Monies are set aside each year to fund engineering and development of water projects for a future water plant. Funding for such a venture has not been determined yet.
Additional Information
Has this system participated in regional water supply or water use planning? Yes, Conover partners with the City of Hickory and Catawba County to serve the Town of Claremont and portions of Southeastern Catawba County. Consideration is given to the regional needs each time the system is improved or expanded.
What major water supply reports or studies were used for planning? Conover has utilized the following engineered plans and studies: (1) Conover, Claremont, Southeastern Area Water Plan and Southeastern Catawba County Area Water Study. System growth related projects are also topics during each annual council/Staff retreat. Internal plans may be altered or approved during these sessions.
Please describe any other needs or issues regarding your water supply sources, any water system deficiencies or needed improvements (storage, treatment, etc.) or your ability to meet present and future water needs. Include both quantity and quality considerations, as well as financial, technical, managerial, permitting, and compliance issues: System improvements are planned for by utilization of a Ten (10) year Capital Improvement Plan. Projects are reviewed and funded annually. The project needs are identified include looping of water lines to enhance water quality, replacement of aged infrastructure that is beginning to fail, online distribution water quality monitoring and additional automation to improve the quality of the water supplied.
The Division of Water Resources (DWR) provides the data contained within this
Local Water Supply Plan (LWSP) as a courtesy and service to our customers.
DWR staff does not field verify data. Neither DWR, nor any other party
involved in the preparation of this LWSP attests that the data is completely
free of errors and omissions. Furthermore, data users are cautioned that
LWSPs labeled PROVISIONAL have yet to be reviewed by DWR staff. Subsequent
review may result in significant revision. Questions regarding the accuracy
or limitations of usage of this data should be directed to the water system
and/or DWR.
|