|
The Division of Water Resources (DWR) provides the data contained within this
Local Water Supply Plan (LWSP) as a courtesy and service to our customers.
DWR staff does not field verify data. Neither DWR, nor any other party
involved in the preparation of this LWSP attests that the data is completely
free of errors and omissions. Furthermore, data users are cautioned that
LWSPs labeled PROVISIONAL have yet to be reviewed by DWR staff. Subsequent
review may result in significant revision. Questions regarding the accuracy
or limitations of usage of this data should be directed to the water system
and/or DWR.
1. System Information
Contact Information
Complete
| Water System Name: |
Longview |
|
PWSID: |
01-18-025 |
| Mailing Address: | 2404 1st Avenue SW
Hickory, NC 28602 | Ownership: | Municipality |
| |
| Contact Person: | Chris Eckard | Title: | Public Works Director |
| Phone: | 828-322-3921 | Cell/Mobile: | -- |
| |
| Secondary Contact: | Michael Patton | | Phone: | 828-328-2024 |
| Mailing Address: | 1240 19th Street Lane NW
Hickory, NC 28601 | Cell/Mobile: | -- |
Distribution System
| Line Type |
Size Range (Inches) |
Estimated % of lines |
| Asbestos Cement |
6 |
1.00 % |
| Cast Iron |
6-10 |
35.00 % |
| Ductile Iron |
6-12 |
25.00 % |
| Galvanized Iron |
.75-2 |
10.00 % |
| Other |
2 |
0.00 % |
| Polyvinyl Chloride |
6-12 |
29.00 % |
Programs
Water Conservation
2. Water Use Information
Service Area
| Sub-Basin(s) | % of Service Population |
|---|
| Catawba River (03-1) | 100 % |
|
| County(s) | % of Service Population |
|---|
| Catawba | 100 % |
|
Water Use by Type
| Type of Use |
Metered
Connections |
Metered
Average Use (MGD) |
Non-Metered
Connections |
Non-Metered
Estimated Use (MGD) |
| Residential |
2,312 |
0.2681 |
0 |
0.0000 |
| Commercial |
180 |
0.2112 |
0 |
0.0000 |
| Industrial |
0 |
0.0000 |
0 |
0.0000 |
| Institutional |
0 |
0.0000 |
0 |
0.0000 |
How much water was used for system processes (backwash, line cleaning, flushing, etc.)? 0.0300 MGD
The Town switched to a new water billing software system in early 2025, which is organized much better and easier to use. There is a noted decrease in the Town's accounting of water use for Year 2024 using this new software. Also, the accounting of the number of residential and commercial accounts is more accurate.
Regarding the high amount of unaccounted-for-water (31% of supply) - We believe that the large amount of Non-Revenue water is mainly from these areas, but most likely the largest culprit is suspected to be the last one:
A portion of the water distribution system is old pipe, more vulnerable to leaks,
Many of the water hydrants are old, and are also prone to leaks, and
The Southwest Elevated Storage Tank. Operationally there were many issues and there were almost daily overflows at the 6-inch overflow pipe as well as at the top. During most nights the tank was overflowing for up to several hours. The Town finally shut down this tank in 2024 (not sure which month) to stop this water loss. At this point the Tank is off-line, and the Town is investigating the best way to bring the tank back on-line, but with measures to stop the tank overflows. Water Sales
| Purchaser |
PWSID |
Average
Daily Sold
(MGD) |
Days
Used |
Contract |
Required to
comply with water
use restrictions? |
Pipe Size(s)
(Inches) |
Use
Type |
| MGD |
Expiration |
Recurring |
| Burke County |
01-12-065 |
0.0305 |
366 |
0.0000 |
|
Yes |
Yes |
12 |
Regular |
3. Water Supply Sources
Monthly Withdrawals & Purchases
|
Average Daily
Use (MGD) |
Max Day
Use (MGD) |
|
Average Daily
Use (MGD) |
Max Day
Use (MGD) |
|
Average Daily
Use (MGD) |
Max Day
Use (MGD) |
| Jan |
0.7641 |
|
May |
0.7861 |
|
Sep |
0.8823 |
|
| Feb |
0.9401 |
|
Jun |
0.7976 |
|
Oct |
0.8861 |
|
| Mar |
0.6798 |
|
Jul |
0.7256 |
|
Nov |
0.7362 |
|
| Apr |
0.8005 |
|
Aug |
0.6572 |
|
Dec |
0.7414 |
|

Surface Water Sources
| Stream |
Reservoir |
Average Daily Withdrawal |
Maximum Day
Withdrawal (MGD) |
Available Raw
Water Supply |
Usable On-Stream
Raw Water Supply
Storage (MG) |
| MGD |
Days Used |
MGD |
* Qualifier |
| Lake Hickory |
|
0.0000 |
0 |
0.0000 |
2.5000 |
C |
3,750.0000 |
* Qualifier: C=Contract Amount, SY20=20-year Safe Yield, SY50=50-year Safe Yield, F=20% of 7Q10 or other instream flow requirement, CUA=Capacity Use Area Permit
Surface Water Sources (continued)
| Stream |
Reservoir |
Drainage Area
(sq mi) |
Metered? |
Sub-Basin |
County |
Year
Offline |
Use
Type |
| Lake Hickory |
|
1,310 |
Yes |
Catawba River (03-1) |
Catawba |
|
Regular |
Water Purchases From Other Systems
| Seller |
PWSID |
Average
Daily Purchased
(MGD) |
Days
Used |
Contract |
Required to
comply with water
use restrictions? |
Pipe Size(s)
(Inches) |
Use
Type |
| MGD |
Expiration |
Recurring |
| Hickory |
01-18-010 |
0.7820 |
366 |
2.5000 |
2040 |
Yes |
Yes |
8,12 |
Regular |
Water Treatment Plants
| Plant Name |
Permitted Capacity
(MGD) |
Is Raw Water Metered? |
Is Finished Water Ouput Metered? |
Source |
| City of Hickory WTP |
32.0000 |
Yes |
Yes |
Lake Hickory/Catawba River Basin |
4. Wastewater Information
Monthly Discharges
|
Average Daily
Discharge (MGD) |
|
Average Daily
Discharge (MGD) |
|
Average Daily
Discharge (MGD) |
| Jan |
0.3685 |
May |
0.5230 |
Sep |
0.3999 |
| Feb |
0.6229 |
Jun |
0.1679 |
Oct |
0.4573 |
| Mar |
0.4018 |
Jul |
0.3319 |
Nov |
0.2760 |
| Apr |
0.3000 |
Aug |
0.2844 |
Dec |
0.2741 |
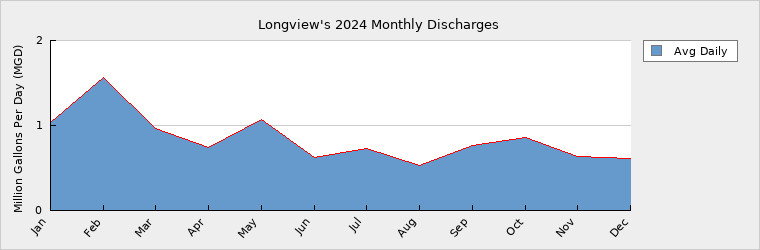
Burke County and Hildebran sewer passes through Longview. The Longview monthly flows were calculated by subtracting those flows from Burke and Hildebran. Monthly averages reported in previous LWSPs have included Burke and Hildebran flows. Wastewater Interconnections
| Water System |
PWSID |
Type |
Average Daily Amount |
Contract
Maximum (MGD) |
| MGD |
Days Used |
| Hickory Henry Fork WWTP |
01-18-010 |
Discharging |
0.3668 |
366 |
1.5000 |
As noted in the Hickory LWSP, Burke County and Hildebran sewer passes through Longview. The Longview flow of 0.3668 MGD was calculated by subtracting those flows passing through from Burke and Hildebran.
5. Planning
Projections
| |
2024 |
2030 |
2040 |
2050 |
2060 |
2070 |
| Year-Round Population |
5,201 |
5,279 |
5,440 |
5,605 |
5,776 |
5,952 |
| Seasonal Population |
0 |
0 |
0 |
0 |
0 |
0 |
| |
| Residential |
0.2681 |
0.2745 |
0.2829 |
0.2915 |
0.3003 |
0.3095 |
| Commercial |
0.2112 |
0.2165 |
0.2330 |
0.2298 |
0.2368 |
0.2440 |
| Industrial |
0.0000 |
0.0000 |
0.0000 |
0.0000 |
0.0000 |
0.0000 |
| Institutional |
0.0000 |
0.0000 |
0.0000 |
0.0000 |
0.0000 |
0.0000 |
| System Process |
0.0300 |
0.0300 |
0.0300 |
0.0300 |
0.0300 |
0.0300 |
| Unaccounted-for |
0.2422 |
0.2453 |
0.2570 |
0.2596 |
0.2670 |
0.2747 |
Demand v/s Percent of Supply
| |
2024 |
2030 |
2040 |
2050 |
2060 |
2070 |
| Surface Water Supply |
2.5000 |
2.5000 |
2.5000 |
2.5000 |
2.5000 |
2.5000 |
| Ground Water Supply |
0.0000 |
0.0000 |
0.0000 |
0.0000 |
0.0000 |
0.0000 |
| Purchases |
2.5000 |
2.5000 |
2.5000 |
2.5000 |
2.5000 |
2.5000 |
| Future Supplies |
0.0000 |
0.0000 |
0.0000 |
0.0000 |
0.0000 |
| Total Available Supply (MGD) |
5.0000 |
5.0000 |
5.0000 |
5.0000 |
5.0000 |
5.0000 |
| Service Area Demand |
0.7515 |
0.7663 |
0.8029 |
0.8109 |
0.8341 |
0.8582 |
| Sales |
0.0305 |
0.0305 |
0.0305 |
0.0305 |
0.0305 |
0.0305 |
| Future Sales |
0.0000 |
0.0000 |
0.0000 |
0.0000 |
0.0000 |
| Total Demand (MGD) |
0.7820 |
0.7968 |
0.8334 |
0.8414 |
0.8646 |
0.8887 |
| Demand as Percent of Supply |
16% |
16% |
17% |
17% |
17% |
18% |

The purpose of the above chart is to show a general indication of how the long-term per capita water demand changes over time. The per capita water demand may actually be different than indicated due to seasonal populations and the accuracy of data submitted. Water systems that have calculated long-term per capita water demand based on a methodology that produces different results may submit their information in the notes field.
Your long-term water demand is 52 gallons per capita per day. What demand management practices do you plan to implement to reduce the per capita water demand (i.e. conduct regular water audits, implement a plumbing retrofit program, employ practices such as rainwater harvesting or reclaimed water)? If these practices are covered elsewhere in your plan, indicate where the practices are discussed here.
No Change
Are there other demand management practices you will implement to reduce your future supply needs? No Change
What supplies other than the ones listed in future supplies are being considered to meet your future supply needs? No Change
How does the water system intend to implement the demand management and supply planning components above? No Change
Additional Information
Has this system participated in regional water supply or water use planning? No
What major water supply reports or studies were used for planning?
Please describe any other needs or issues regarding your water supply sources, any water system deficiencies or needed improvements (storage, treatment, etc.) or your ability to meet present and future water needs. Include both quantity and quality considerations, as well as financial, technical, managerial, permitting, and compliance issues:
The Division of Water Resources (DWR) provides the data contained within this
Local Water Supply Plan (LWSP) as a courtesy and service to our customers.
DWR staff does not field verify data. Neither DWR, nor any other party
involved in the preparation of this LWSP attests that the data is completely
free of errors and omissions. Furthermore, data users are cautioned that
LWSPs labeled PROVISIONAL have yet to be reviewed by DWR staff. Subsequent
review may result in significant revision. Questions regarding the accuracy
or limitations of usage of this data should be directed to the water system
and/or DWR.
|