|
The Division of Water Resources (DWR) provides the data contained within this
Local Water Supply Plan (LWSP) as a courtesy and service to our customers.
DWR staff does not field verify data. Neither DWR, nor any other party
involved in the preparation of this LWSP attests that the data is completely
free of errors and omissions. Furthermore, data users are cautioned that
LWSPs labeled PROVISIONAL have yet to be reviewed by DWR staff. Subsequent
review may result in significant revision. Questions regarding the accuracy
or limitations of usage of this data should be directed to the water system
and/or DWR.
1. System Information
Contact Information
Complete
| Water System Name: |
Cleveland County Water |
|
PWSID: |
01-23-055 |
| Mailing Address: | PO Box 8
Shelby, NC 28151 | Ownership: | District |
| |
| Contact Person: | Chris Hayes | Title: | Distribution Superintendent |
| Phone: | 704-466-3696 | Cell/Mobile: | -- |
| |
| Secondary Contact: | Garrett Gilbert | | Phone: | 704-538-9769 |
| Mailing Address: | PO Box 8
Shelby, NC 28151 | Cell/Mobile: | -- |
Distribution System
| Line Type |
Size Range (Inches) |
Estimated % of lines |
| Ductile Iron |
3-16 |
10.00 % |
| Polyvinyl Chloride |
2-12" |
90.00 % |
Programs
Cleveland County Water strives to reduce consumption by giving conservation tips on our website and giving dye strips to customers Water Conservation
2. Water Use Information
Service Area
| Sub-Basin(s) | % of Service Population |
|---|
| Broad River (01-1) | 100 % |
|
| County(s) | % of Service Population |
|---|
| Cleveland | 96 % |
| Rutherford | 2 % |
| Lincoln | 1 % |
| Gaston | 1 % |
|
Cleveland County Water took over the assets for the Town of Fallston, however we were already billing for the Town of Fallston. We acquired The Town of Fallston in December of 2024. Water Use by Type
| Type of Use |
Metered
Connections |
Metered
Average Use (MGD) |
Non-Metered
Connections |
Non-Metered
Estimated Use (MGD) |
| Residential |
20,991 |
3.1260 |
3,218 |
0.0000 |
| Commercial |
711 |
0.4150 |
0 |
0.0000 |
| Industrial |
8 |
0.2360 |
0 |
0.0000 |
| Institutional |
65 |
0.0560 |
0 |
0.0000 |
How much water was used for system processes (backwash, line cleaning, flushing, etc.)? 0.1980 MGD
Less process water used due to reduced number of leaks and less backwashing. Also, with better tracking we feel this number is more representative of true usage. Non-metered connections are services that are connected to Cleveland County Water's main but does not have a meter installed in the meter box. They are inactive service connections Water Sales
| Purchaser |
PWSID |
Average
Daily Sold
(MGD) |
Days
Used |
Contract |
Required to
comply with water
use restrictions? |
Pipe Size(s)
(Inches) |
Use
Type |
| MGD |
Expiration |
Recurring |
| Boiling Springs |
01-23-025 |
0.0000 |
0 |
0.0000 |
|
Yes |
Yes |
6 |
Emergency |
| Fallston |
01-23-035 |
0.0412 |
334 |
1.0000 |
|
Yes |
Yes |
6 |
Regular |
| Lawndale |
01-23-045 |
0.0434 |
365 |
0.0000 |
|
Yes |
Yes |
6 |
Regular |
The Town of Fallston's water system became Cleveland County Water's in December of 2024. The Town of Lawndale's leaks seemed to be down this year compared to previous year 3. Water Supply Sources
Monthly Withdrawals & Purchases
|
Average Daily
Use (MGD) |
Max Day
Use (MGD) |
|
Average Daily
Use (MGD) |
Max Day
Use (MGD) |
|
Average Daily
Use (MGD) |
Max Day
Use (MGD) |
| Jan |
4.3700 |
5.2400 |
May |
4.2600 |
4.8900 |
Sep |
4.4600 |
5.2500 |
| Feb |
3.8400 |
4.4100 |
Jun |
5.1900 |
6.1800 |
Oct |
4.3900 |
5.1900 |
| Mar |
3.7700 |
4.2800 |
Jul |
5.0100 |
5.9200 |
Nov |
4.1300 |
4.5600 |
| Apr |
4.0000 |
4.3700 |
Aug |
4.8000 |
5.7700 |
Dec |
4.1500 |
4.5800 |

Surface Water Sources
| Stream |
Reservoir |
Average Daily Withdrawal |
Maximum Day
Withdrawal (MGD) |
Available Raw
Water Supply |
Usable On-Stream
Raw Water Supply
Storage (MG) |
| MGD |
Days Used |
MGD |
* Qualifier |
| First Broad River |
|
4.3600 |
366 |
0.0000 |
10.0000 |
F |
0.0000 |
| Knob Creek |
|
0.0000 |
0 |
0.0000 |
0.0000 |
F |
0.0000 |
* Qualifier: C=Contract Amount, SY20=20-year Safe Yield, SY50=50-year Safe Yield, F=20% of 7Q10 or other instream flow requirement, CUA=Capacity Use Area Permit
Surface Water Sources (continued)
| Stream |
Reservoir |
Drainage Area
(sq mi) |
Metered? |
Sub-Basin |
County |
Year
Offline |
Use
Type |
| First Broad River |
|
190 |
Yes |
Broad River (01-1) |
Cleveland |
|
Regular |
| Knob Creek |
|
50 |
Yes |
Broad River (01-1) |
Cleveland |
|
Emergency |
Water Purchases From Other Systems
| Seller |
PWSID |
Average
Daily Purchased
(MGD) |
Days
Used |
Contract |
Required to
comply with water
use restrictions? |
Pipe Size(s)
(Inches) |
Use
Type |
| MGD |
Expiration |
Recurring |
| Boiling Springs Water |
01-81-035 |
0.0000 |
0 |
0.0000 |
|
Yes |
Yes |
3 |
Emergency |
| Broad River Water Authority |
01-81-035 |
0.0000 |
0 |
0.0000 |
|
Yes |
Yes |
6 |
Emergency |
| City of Shelby |
01-23-010 |
0.0000 |
0 |
0.0000 |
|
Yes |
Yes |
6 |
Emergency |
| City of Shelby |
01-23-010 |
0.0000 |
0 |
|
|
Yes |
Yes |
6 |
Emergency |
| Grassy Pond Water |
20-23-003 |
0.0000 |
0 |
|
|
Yes |
Yes |
2 |
Emergency |
| Kings Mountain |
01-23-020 |
0.0109 |
62 |
0.0000 |
|
Yes |
Yes |
6 |
Emergency |
| Town of Blacksburg |
11-10-002 |
0.0003 |
365 |
0.0000 |
|
Yes |
Yes |
2 |
Regular |
All emergency connections are controlled by each water utility calling the other one before they turn the connection on or off. There isn't any contracts, volumes, or expiration dates Water Treatment Plants
| Plant Name |
Permitted Capacity
(MGD) |
Is Raw Water Metered? |
Is Finished Water Ouput Metered? |
Source |
| Cleveland County Water WTP |
7.3250 |
Yes |
Yes |
First Broad River |
4. Wastewater Information
Monthly Discharges
|
Average Daily
Discharge (MGD) |
|
Average Daily
Discharge (MGD) |
|
Average Daily
Discharge (MGD) |
| Jan |
0.0852 |
May |
0.0470 |
Sep |
0.0520 |
| Feb |
0.0852 |
Jun |
0.0247 |
Oct |
0.0338 |
| Mar |
0.0489 |
Jul |
0.0190 |
Nov |
0.0648 |
| Apr |
0.0423 |
Aug |
0.0475 |
Dec |
0.0286 |
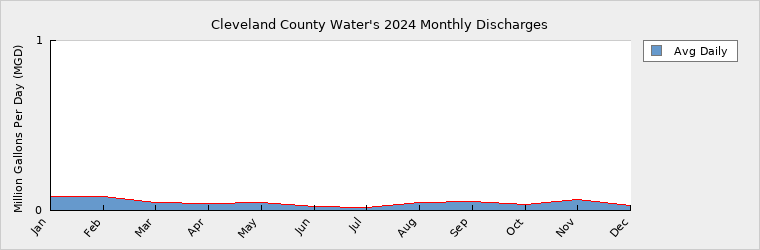
CCW had the waste water pond dredged this past year and didn’t have to run the waste water pump as much Wastewater Permits
| Permit Number |
Type |
Permitted Capacity
(MGD) |
Design Capacity
(MGD) |
Average Annual
Daily Discharge
(MGD) |
Maximum Day Discharge
(MGD) |
Receiving Stream |
Receiving Basin |
| NCG590004 |
WTP |
0.0980 |
6.0000 |
0.0482 |
0.1000 |
First Broad River |
Broad River (01-1) |
5. Planning
Projections
| |
2024 |
2030 |
2040 |
2050 |
2060 |
2070 |
| Year-Round Population |
58,755 |
63,201 |
71,951 |
80,701 |
89,451 |
98,201 |
| Seasonal Population |
0 |
0 |
0 |
0 |
0 |
0 |
| |
| Residential |
3.1260 |
3.4129 |
3.8854 |
4.3579 |
4.8304 |
5.3029 |
| Commercial |
0.4150 |
0.4390 |
0.4890 |
0.5390 |
0.5890 |
0.6390 |
| Industrial |
0.2360 |
0.2600 |
0.2900 |
0.3000 |
0.3100 |
0.3200 |
| Institutional |
0.0560 |
0.0840 |
0.0958 |
0.1073 |
0.1190 |
0.1310 |
| System Process |
0.1980 |
0.0650 |
0.0700 |
0.0750 |
0.0800 |
0.0850 |
| Unaccounted-for |
0.2502 |
0.5653 |
0.6742 |
0.7662 |
0.8731 |
0.9742 |
Cleveland County Water has in it's Capital Improvement Plan to construct a new Water Treatment Plant on the Broad River in 2028 Future Supply Sources
| Source Name |
PWSID |
Source Type |
Additional Supply |
Year Online |
Year Offline |
Type |
| Cleveland County Water |
01-23-055 |
Surface |
6.0000 |
2030 |
|
Regular |
Demand v/s Percent of Supply
| |
2024 |
2030 |
2040 |
2050 |
2060 |
2070 |
| Surface Water Supply |
10.0000 |
10.0000 |
10.0000 |
10.0000 |
10.0000 |
10.0000 |
| Ground Water Supply |
0.0000 |
0.0000 |
0.0000 |
0.0000 |
0.0000 |
0.0000 |
| Purchases |
0.0112 |
0.0112 |
0.0112 |
0.0112 |
0.0112 |
0.0112 |
| Future Supplies |
6.0000 |
6.0000 |
6.0000 |
6.0000 |
6.0000 |
| Total Available Supply (MGD) |
10.0112 |
16.0112 |
16.0112 |
16.0112 |
16.0112 |
16.0112 |
| Service Area Demand |
4.2812 |
4.8262 |
5.5044 |
6.1454 |
6.8015 |
7.4521 |
| Sales |
0.0809 |
1.0434 |
1.0434 |
1.0434 |
1.0434 |
1.0434 |
| Future Sales |
0.0000 |
0.0000 |
0.0000 |
0.0000 |
0.0000 |
| Total Demand (MGD) |
4.3621 |
5.8696 |
6.5478 |
7.1888 |
7.8449 |
8.4955 |
| Demand as Percent of Supply |
44% |
37% |
41% |
45% |
49% |
53% |

The purpose of the above chart is to show a general indication of how the long-term per capita water demand changes over time. The per capita water demand may actually be different than indicated due to seasonal populations and the accuracy of data submitted. Water systems that have calculated long-term per capita water demand based on a methodology that produces different results may submit their information in the notes field.
Your long-term water demand is 53 gallons per capita per day. What demand management practices do you plan to implement to reduce the per capita water demand (i.e. conduct regular water audits, implement a plumbing retrofit program, employ practices such as rainwater harvesting or reclaimed water)? If these practices are covered elsewhere in your plan, indicate where the practices are discussed here.
Are there other demand management practices you will implement to reduce your future supply needs?
What supplies other than the ones listed in future supplies are being considered to meet your future supply needs?
How does the water system intend to implement the demand management and supply planning components above? Cleveland County Water will continue to ensure that the capital improvement plan is being implemented and updated to meet future long-term needs through different funding opportunities and planning
Additional Information
Has this system participated in regional water supply or water use planning? Yes, Yes, CDM Smith completed a Water Demand Project study in 2015
What major water supply reports or studies were used for planning? 2020 WTP Condition Assessment, Assessment Inventory, Water System GIS
Please describe any other needs or issues regarding your water supply sources, any water system deficiencies or needed improvements (storage, treatment, etc.) or your ability to meet present and future water needs. Include both quantity and quality considerations, as well as financial, technical, managerial, permitting, and compliance issues: Cleveland County Water has a long term capital improvement plan that was produced thru the asset inventory assessment. This CIP has listed distribution area deficiencies and projected future water tanks, pump stations, and waterlines for future long term water needs.
The Division of Water Resources (DWR) provides the data contained within this
Local Water Supply Plan (LWSP) as a courtesy and service to our customers.
DWR staff does not field verify data. Neither DWR, nor any other party
involved in the preparation of this LWSP attests that the data is completely
free of errors and omissions. Furthermore, data users are cautioned that
LWSPs labeled PROVISIONAL have yet to be reviewed by DWR staff. Subsequent
review may result in significant revision. Questions regarding the accuracy
or limitations of usage of this data should be directed to the water system
and/or DWR.
|