|
The Division of Water Resources (DWR) provides the data contained within this
Local Water Supply Plan (LWSP) as a courtesy and service to our customers.
DWR staff does not field verify data. Neither DWR, nor any other party
involved in the preparation of this LWSP attests that the data is completely
free of errors and omissions. Furthermore, data users are cautioned that
LWSPs labeled PROVISIONAL have yet to be reviewed by DWR staff. Subsequent
review may result in significant revision. Questions regarding the accuracy
or limitations of usage of this data should be directed to the water system
and/or DWR.
1. System Information
Contact Information
Complete
| Water System Name: |
Mount Holly |
|
PWSID: |
01-36-020 |
| Mailing Address: | P.O. Box 406
Mount Holly, NC 28120 | Ownership: | Municipality |
| |
| Contact Person: | Jeff Womack | Title: | Division Manager/ORC |
| Phone: | 704-822-2928 | Cell/Mobile: | -- |
| |
| Secondary Contact: | Robert Stewart | | Phone: | 704-951-0074 |
| Mailing Address: | P.O. Box 406
Mount Holly, NC 28120 | Cell/Mobile: | -- |
Distribution System
| Line Type |
Size Range (Inches) |
Estimated % of lines |
| Asbestos Cement |
6-10 |
1.00 % |
| Cast Iron |
6-10 |
3.00 % |
| Ductile Iron |
3-20 |
82.00 % |
| Galvanized Iron |
2 |
5.00 % |
| Polyvinyl Chloride |
2-6 |
9.00 % |
Programs
Water Conservation
2. Water Use Information
Service Area
| Sub-Basin(s) | % of Service Population |
|---|
| Catawba River (03-1) | 100 % |
|
| County(s) | % of Service Population |
|---|
| Gaston | 100 % |
|
Water Use by Type
| Type of Use |
Metered
Connections |
Metered
Average Use (MGD) |
Non-Metered
Connections |
Non-Metered
Estimated Use (MGD) |
| Residential |
7,882 |
1.1329 |
0 |
0.0000 |
| Commercial |
307 |
0.1842 |
0 |
0.0000 |
| Industrial |
16 |
0.5345 |
0 |
0.0000 |
| Institutional |
76 |
0.0458 |
0 |
0.0000 |
How much water was used for system processes (backwash, line cleaning, flushing, etc.)? 0.1913 MGD
Backwash Water - 0.0551
Flushing Program - 0.0041
Basin Washes & other Plant Process - 0.187 (Taken from Hach Flodar)
Our wholesale should be added to this section as we meter and withdraw an average of 0.8123 MGD to the Town of Stanley. The Town of Stanley uses 0.5409 MGD, Mount Holly uses 0.2714 MGD from the Stanley Tank.
The report volume of Industrial water use in 2024 includes 0.2703 MGD of raw water supplied to National Gypsum. Water Sales
| Purchaser |
PWSID |
Average
Daily Sold
(MGD) |
Days
Used |
Contract |
Required to
comply with water
use restrictions? |
Pipe Size(s)
(Inches) |
Use
Type |
| MGD |
Expiration |
Recurring |
| City of Belmont |
01-36-015 |
0.0000 |
0 |
|
2028 |
Yes |
Yes |
8 |
Emergency |
| Stanley |
01-36-035 |
0.5409 |
366 |
0.6000 |
2035 |
No |
Yes |
12 |
Regular |
Review of current water sales agreement with the Town of Stanley shows an agreement beginning in 2005 for 600,000 gallons of water per day. Mount Holly and Stanley are currently negotiating a new agreement for 20 years which shall supersede prior agreements with a 100,000 gallons per day increase up to 700,000 gallons of water per day. If finalized this year -- in 2025, the additional 100,000 gpd in sales will be shown in next year's (2025) LWSP. 3. Water Supply Sources
Monthly Withdrawals & Purchases
|
Average Daily
Use (MGD) |
Max Day
Use (MGD) |
|
Average Daily
Use (MGD) |
Max Day
Use (MGD) |
|
Average Daily
Use (MGD) |
Max Day
Use (MGD) |
| Jan |
2.5922 |
2.9660 |
May |
2.7446 |
3.1560 |
Sep |
2.9039 |
4.2300 |
| Feb |
2.6057 |
3.2340 |
Jun |
3.1906 |
4.1450 |
Oct |
2.9240 |
3.6570 |
| Mar |
2.6984 |
3.0450 |
Jul |
3.1837 |
4.0210 |
Nov |
2.5863 |
3.1050 |
| Apr |
2.5714 |
3.0440 |
Aug |
2.9360 |
3.9140 |
Dec |
2.4069 |
2.7870 |

Surface Water Sources
| Stream |
Reservoir |
Average Daily Withdrawal |
Maximum Day
Withdrawal (MGD) |
Available Raw
Water Supply |
Usable On-Stream
Raw Water Supply
Storage (MG) |
| MGD |
Days Used |
MGD |
* Qualifier |
| Catawba |
Mt. Island lake |
2.7868 |
365 |
0.0000 |
13.5000 |
C |
334.0000 |
* Qualifier: C=Contract Amount, SY20=20-year Safe Yield, SY50=50-year Safe Yield, F=20% of 7Q10 or other instream flow requirement, CUA=Capacity Use Area Permit
Surface Water Sources (continued)
| Stream |
Reservoir |
Drainage Area
(sq mi) |
Metered? |
Sub-Basin |
County |
Year
Offline |
Use
Type |
| Catawba |
Mt. Island lake |
1,860 |
Yes |
Catawba River (03-1) |
Gaston |
|
Regular |
Water Purchases From Other Systems
| Seller |
PWSID |
Average
Daily Purchased
(MGD) |
Days
Used |
Contract |
Required to
comply with water
use restrictions? |
Pipe Size(s)
(Inches) |
Use
Type |
| MGD |
Expiration |
Recurring |
| City of Belmont |
01-36-015 |
0.0000 |
0 |
0.0000 |
2039 |
Yes |
Yes |
8 |
Emergency |
Water Treatment Plants
| Plant Name |
Permitted Capacity
(MGD) |
Is Raw Water Metered? |
Is Finished Water Ouput Metered? |
Source |
| Mount Holly WTP |
6.0000 |
Yes |
Yes |
Mt. Island Lake |
4. Wastewater Information
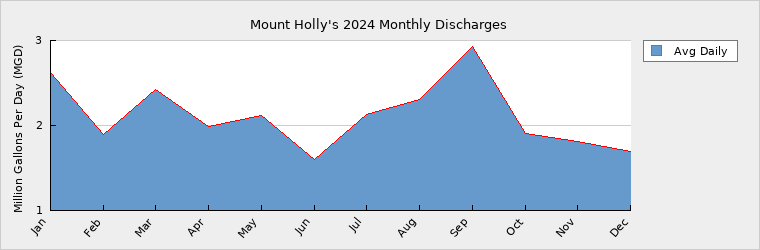
Monthly Discharges
|
Average Daily
Discharge (MGD) |
|
Average Daily
Discharge (MGD) |
|
Average Daily
Discharge (MGD) |
| Jan |
2.6210 |
May |
2.1200 |
Sep |
2.9240 |
| Feb |
1.8990 |
Jun |
1.5950 |
Oct |
1.9060 |
| Mar |
2.4280 |
Jul |
2.1250 |
Nov |
1.8090 |
| Apr |
1.9910 |
Aug |
2.3070 |
Dec |
1.6910 |
Mount Holly Wastewater with Charlotte Wastewater are building a new facility on the Charlotte side of the Catawba River with a online date of late summer, early fall 2025. Wastewater Permits
| Permit Number |
Type |
Permitted Capacity
(MGD) |
Design Capacity
(MGD) |
Average Annual
Daily Discharge
(MGD) |
Maximum Day Discharge
(MGD) |
Receiving Stream |
Receiving Basin |
| NC0021156 |
WWTP |
4.0000 |
4.0000 |
2.1180 |
|
Catawba River |
Catawba River (03-1) |
5. Planning
Projections
| |
2024 |
2030 |
2040 |
2050 |
2060 |
2070 |
| Year-Round Population |
21,281 |
24,200 |
29,766 |
36,612 |
45,033 |
55,391 |
| Seasonal Population |
0 |
24,675 |
30,350 |
37,331 |
45,917 |
56,477 |
| |
| Residential |
1.1329 |
1.2900 |
1.5770 |
1.8924 |
2.2709 |
2.7251 |
| Commercial |
0.1842 |
0.1953 |
0.2148 |
0.2363 |
0.2599 |
0.2859 |
| Industrial |
0.5345 |
0.2801 |
0.3081 |
0.3389 |
0.3727 |
0.4100 |
| Institutional |
0.0458 |
0.0486 |
0.0534 |
0.0588 |
0.0646 |
0.0711 |
| System Process |
0.1913 |
0.2612 |
0.2873 |
0.3160 |
0.3476 |
0.3824 |
| Unaccounted-for |
0.1496 |
0.2000 |
0.1840 |
0.2263 |
0.2584 |
0.3024 |
Demand v/s Percent of Supply
| |
2024 |
2030 |
2040 |
2050 |
2060 |
2070 |
| Surface Water Supply |
13.5000 |
13.5000 |
13.5000 |
13.5000 |
13.5000 |
13.5000 |
| Ground Water Supply |
0.0000 |
0.0000 |
0.0000 |
0.0000 |
0.0000 |
0.0000 |
| Purchases |
0.0000 |
0.0000 |
0.0000 |
0.0000 |
0.0000 |
0.0000 |
| Future Supplies |
0.0000 |
0.0000 |
0.0000 |
0.0000 |
0.0000 |
| Total Available Supply (MGD) |
13.5000 |
13.5000 |
13.5000 |
13.5000 |
13.5000 |
13.5000 |
| Service Area Demand |
2.2383 |
2.2752 |
2.6246 |
3.0687 |
3.5741 |
4.1769 |
| Sales |
0.5409 |
0.6000 |
0.0000 |
0.0000 |
0.0000 |
0.0000 |
| Future Sales |
0.0000 |
0.0000 |
0.0000 |
0.0000 |
0.0000 |
| Total Demand (MGD) |
2.7792 |
2.8752 |
2.6246 |
3.0687 |
3.5741 |
4.1769 |
| Demand as Percent of Supply |
21% |
21% |
19% |
23% |
26% |
31% |

The purpose of the above chart is to show a general indication of how the long-term per capita water demand changes over time. The per capita water demand may actually be different than indicated due to seasonal populations and the accuracy of data submitted. Water systems that have calculated long-term per capita water demand based on a methodology that produces different results may submit their information in the notes field.
Your long-term water demand is 53 gallons per capita per day. What demand management practices do you plan to implement to reduce the per capita water demand (i.e. conduct regular water audits, implement a plumbing retrofit program, employ practices such as rainwater harvesting or reclaimed water)? If these practices are covered elsewhere in your plan, indicate where the practices are discussed here.
Are there other demand management practices you will implement to reduce your future supply needs?
What supplies other than the ones listed in future supplies are being considered to meet your future supply needs?
How does the water system intend to implement the demand management and supply planning components above?
Additional Information
Has this system participated in regional water supply or water use planning? Yes, Yes, Catawba Wateree Management Group
What major water supply reports or studies were used for planning? Catawba Wateree Management Group
Please describe any other needs or issues regarding your water supply sources, any water system deficiencies or needed improvements (storage, treatment, etc.) or your ability to meet present and future water needs. Include both quantity and quality considerations, as well as financial, technical, managerial, permitting, and compliance issues:
The Division of Water Resources (DWR) provides the data contained within this
Local Water Supply Plan (LWSP) as a courtesy and service to our customers.
DWR staff does not field verify data. Neither DWR, nor any other party
involved in the preparation of this LWSP attests that the data is completely
free of errors and omissions. Furthermore, data users are cautioned that
LWSPs labeled PROVISIONAL have yet to be reviewed by DWR staff. Subsequent
review may result in significant revision. Questions regarding the accuracy
or limitations of usage of this data should be directed to the water system
and/or DWR.
|