|
The Division of Water Resources (DWR) provides the data contained within this
Local Water Supply Plan (LWSP) as a courtesy and service to our customers.
DWR staff does not field verify data. Neither DWR, nor any other party
involved in the preparation of this LWSP attests that the data is completely
free of errors and omissions. Furthermore, data users are cautioned that
LWSPs labeled PROVISIONAL have yet to be reviewed by DWR staff. Subsequent
review may result in significant revision. Questions regarding the accuracy
or limitations of usage of this data should be directed to the water system
and/or DWR.
1. System Information
Contact Information
Complete
| Water System Name: |
Bessemer City |
|
PWSID: |
01-36-025 |
| Mailing Address: | 125 E. Virginia Avenue
Bessemer City, NC 28016 | Ownership: | Municipality |
| |
| Contact Person: | Ashton Lingerfelt | Title: | Water Plant ORC |
| Phone: | 704-629-5684 | Cell/Mobile: | -- |
| |
| Secondary Contact: | Jamie Ramsey ( PW Director) | | Phone: | 704-729-6529 |
| Mailing Address: | 125 E. Virginia Ave
Bessemer City, NC 28016 | Cell/Mobile: | -- |
Distribution System
| Line Type |
Size Range (Inches) |
Estimated % of lines |
| Asbestos Cement |
6 |
10.00 % |
| Cast Iron |
4-12 |
20.00 % |
| Ductile Iron |
4-12 |
42.00 % |
| Galvanized Iron |
.75-2 |
1.00 % |
| Polyvinyl Chloride |
2-16 |
27.00 % |
Programs
We use Badger Meter(Beacon) program to help detect and monitor leaks in the distribution system. Water Conservation
2. Water Use Information
Service Area
| Sub-Basin(s) | % of Service Population |
|---|
| South Fork Catawba River (03-2) | 76 % |
| Catawba River (03-1) | 24 % |
|
| County(s) | % of Service Population |
|---|
| Gaston | 100 % |
|
Water Use by Type
| Type of Use |
Metered
Connections |
Metered
Average Use (MGD) |
Non-Metered
Connections |
Non-Metered
Estimated Use (MGD) |
| Residential |
2,512 |
0.2638 |
0 |
0.0000 |
| Commercial |
188 |
0.0323 |
0 |
0.0000 |
| Industrial |
32 |
0.3993 |
0 |
0.0000 |
| Institutional |
43 |
0.0260 |
2 |
0.0000 |
How much water was used for system processes (backwash, line cleaning, flushing, etc.)? 0.0776 MGD
Ave. metered use is measured through beacon metering service and billing.
Non Metered connections- Water treatment facility and pump stations for sampling/cleaning. (39gpd)
Processed Water includes- Hydrant flushing, basin cleaning, filter backwash, chemical pump push-water, chemical mixtures, sample pumps, cl2/ntu Instruments and trial running during shutdowns.
**This number excludes some fire dept usage, any leaks, main breaks, etc.. 3. Water Supply Sources
Monthly Withdrawals & Purchases
|
Average Daily
Use (MGD) |
Max Day
Use (MGD) |
|
Average Daily
Use (MGD) |
Max Day
Use (MGD) |
|
Average Daily
Use (MGD) |
Max Day
Use (MGD) |
| Jan |
0.9490 |
1.2660 |
May |
1.0798 |
1.4350 |
Sep |
1.1131 |
1.3930 |
| Feb |
0.9570 |
1.1840 |
Jun |
1.1728 |
1.7250 |
Oct |
1.0460 |
1.3450 |
| Mar |
0.9810 |
1.3070 |
Jul |
1.1301 |
1.4420 |
Nov |
0.8443 |
1.0160 |
| Apr |
1.0552 |
1.4910 |
Aug |
1.1213 |
1.6030 |
Dec |
0.9129 |
1.2470 |
We have a 110mg reservoir of storage, the water in/ out will not account for the levels of water we used without pumping those days. The levels of which will fluctuate on a daily basis. 
Surface Water Sources
| Stream |
Reservoir |
Average Daily Withdrawal |
Maximum Day
Withdrawal (MGD) |
Available Raw
Water Supply |
Usable On-Stream
Raw Water Supply
Storage (MG) |
| MGD |
Days Used |
MGD |
* Qualifier |
| Long Creek |
Arrowood |
1.8280 |
160 |
0.0000 |
2.7764 |
SY20 |
0.0000 |
* Qualifier: C=Contract Amount, SY20=20-year Safe Yield, SY50=50-year Safe Yield, F=20% of 7Q10 or other instream flow requirement, CUA=Capacity Use Area Permit
Surface Water Sources (continued)
| Stream |
Reservoir |
Drainage Area
(sq mi) |
Metered? |
Sub-Basin |
County |
Year
Offline |
Use
Type |
| Long Creek |
Arrowood |
12 |
No |
South Fork Catawba River (03-2) |
Gaston |
|
Regular |
1200gpm pump, at 160 days total pumping. Water Purchases From Other Systems
| Seller |
PWSID |
Average
Daily Purchased
(MGD) |
Days
Used |
Contract |
Required to
comply with water
use restrictions? |
Pipe Size(s)
(Inches) |
Use
Type |
| MGD |
Expiration |
Recurring |
| Gastonia |
01-36-010 |
1.0500 |
70 |
0.0000 |
|
No |
Yes |
12 |
Emergency |
| Kings Mountain |
01-23-020 |
0.0004 |
2 |
|
|
Yes |
Yes |
12 |
Emergency |
Water Treatment facility experienced abnormally high levels of iron and manganese during heavy rainfall and after hurricane Helan, which exceeded our treatment capabilities at the time. Water purchased was greater this year due to that reason. Improvements to treatment process have since been made to increase removal of iron and manganese to prevent excessive purchasing in the future. Water Treatment Plants
| Plant Name |
Permitted Capacity
(MGD) |
Is Raw Water Metered? |
Is Finished Water Ouput Metered? |
Source |
| J.V. Tarpley WT Facility |
3.0000 |
Yes |
Yes |
Long Creek, Webber Reservoir, Arrowood Reservoir |
New housing developments and apartment complexes are being added to the community. Noticing a rise in demand, longer run times and increased plant rates to keep up. 4. Wastewater Information
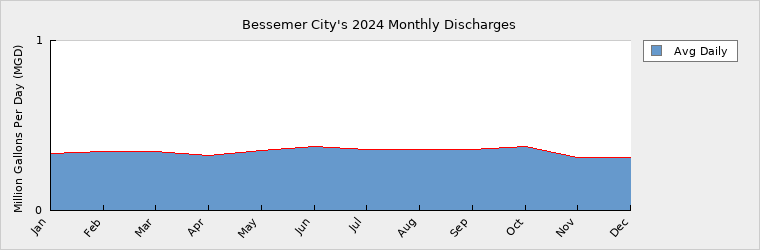
Monthly Discharges
|
Average Daily
Discharge (MGD) |
|
Average Daily
Discharge (MGD) |
|
Average Daily
Discharge (MGD) |
| Jan |
0.3330 |
May |
0.3520 |
Sep |
0.3580 |
| Feb |
0.3470 |
Jun |
0.3780 |
Oct |
0.3790 |
| Mar |
0.3460 |
Jul |
0.3560 |
Nov |
0.3140 |
| Apr |
0.3220 |
Aug |
0.3570 |
Dec |
0.3100 |
Wastewater Interconnections
| Water System |
PWSID |
Type |
Average Daily Amount |
Contract
Maximum (MGD) |
| MGD |
Days Used |
| Two Rivers-Gastonia |
01-36-010 |
Discharging |
0.3400 |
366 |
1.6080 |
Bessemer City has 2 permitted sewer connections with Two Rivers Utilities with separates contracts: Oates Rd. with a contract maximum of 1.000 MGD and Abernethy Creek with a contract maximum of 0.608 MGD. 5. Planning
Projections
| |
2024 |
2030 |
2040 |
2050 |
2060 |
2070 |
| Year-Round Population |
5,690 |
5,736 |
5,802 |
5,912 |
6,020 |
6,132 |
| Seasonal Population |
0 |
0 |
0 |
0 |
0 |
0 |
| |
| Residential |
0.2638 |
0.2550 |
0.2560 |
0.2600 |
0.2660 |
0.2700 |
| Commercial |
0.0323 |
0.0520 |
0.0450 |
0.0480 |
0.0500 |
0.0550 |
| Industrial |
0.3993 |
0.6330 |
0.6530 |
0.6720 |
0.6920 |
0.6730 |
| Institutional |
0.0260 |
0.0500 |
0.0520 |
0.0540 |
0.0560 |
0.0580 |
| System Process |
0.0776 |
0.1100 |
0.1122 |
0.1144 |
0.1167 |
0.1191 |
| Unaccounted-for |
0.2009 |
0.2000 |
0.2050 |
0.2070 |
0.2090 |
0.2110 |
Demand v/s Percent of Supply
| |
2024 |
2030 |
2040 |
2050 |
2060 |
2070 |
| Surface Water Supply |
2.7764 |
2.7764 |
2.7764 |
2.7764 |
2.7764 |
2.7764 |
| Ground Water Supply |
0.0000 |
0.0000 |
0.0000 |
0.0000 |
0.0000 |
0.0000 |
| Purchases |
1.0500 |
1.0500 |
1.0500 |
1.0500 |
1.0500 |
1.0500 |
| Future Supplies |
0.0000 |
0.0000 |
0.0000 |
0.0000 |
0.0000 |
| Total Available Supply (MGD) |
3.8264 |
3.8264 |
3.8264 |
3.8264 |
3.8264 |
3.8264 |
| Service Area Demand |
0.9999 |
1.3000 |
1.3232 |
1.3554 |
1.3897 |
1.3861 |
| Sales |
0.0000 |
0.0000 |
0.0000 |
0.0000 |
0.0000 |
0.0000 |
| Future Sales |
0.0000 |
0.0000 |
0.0000 |
0.0000 |
0.0000 |
| Total Demand (MGD) |
0.9999 |
1.3000 |
1.3232 |
1.3554 |
1.3897 |
1.3861 |
| Demand as Percent of Supply |
26% |
34% |
35% |
35% |
36% |
36% |

The purpose of the above chart is to show a general indication of how the long-term per capita water demand changes over time. The per capita water demand may actually be different than indicated due to seasonal populations and the accuracy of data submitted. Water systems that have calculated long-term per capita water demand based on a methodology that produces different results may submit their information in the notes field.
Your long-term water demand is 46 gallons per capita per day. What demand management practices do you plan to implement to reduce the per capita water demand (i.e. conduct regular water audits, implement a plumbing retrofit program, employ practices such as rainwater harvesting or reclaimed water)? If these practices are covered elsewhere in your plan, indicate where the practices are discussed here.
Are there other demand management practices you will implement to reduce your future supply needs?
What supplies other than the ones listed in future supplies are being considered to meet your future supply needs?
How does the water system intend to implement the demand management and supply planning components above?
Additional Information
Has this system participated in regional water supply or water use planning? No
What major water supply reports or studies were used for planning?
Please describe any other needs or issues regarding your water supply sources, any water system deficiencies or needed improvements (storage, treatment, etc.) or your ability to meet present and future water needs. Include both quantity and quality considerations, as well as financial, technical, managerial, permitting, and compliance issues:
The Division of Water Resources (DWR) provides the data contained within this
Local Water Supply Plan (LWSP) as a courtesy and service to our customers.
DWR staff does not field verify data. Neither DWR, nor any other party
involved in the preparation of this LWSP attests that the data is completely
free of errors and omissions. Furthermore, data users are cautioned that
LWSPs labeled PROVISIONAL have yet to be reviewed by DWR staff. Subsequent
review may result in significant revision. Questions regarding the accuracy
or limitations of usage of this data should be directed to the water system
and/or DWR.
|