|
The Division of Water Resources (DWR) provides the data contained within this
Local Water Supply Plan (LWSP) as a courtesy and service to our customers.
DWR staff does not field verify data. Neither DWR, nor any other party
involved in the preparation of this LWSP attests that the data is completely
free of errors and omissions. Furthermore, data users are cautioned that
LWSPs labeled PROVISIONAL have yet to be reviewed by DWR staff. Subsequent
review may result in significant revision. Questions regarding the accuracy
or limitations of usage of this data should be directed to the water system
and/or DWR.
1. System Information
Contact Information
Complete
| Water System Name: |
Stanley |
|
PWSID: |
01-36-035 |
| Mailing Address: | P.O. Box 279
Stanley, NC 28164 | Ownership: | Municipality |
| |
| Contact Person: | Daniel Hendrix | Title: | Distribution ORC |
| Phone: | 704-201-3992 | Cell/Mobile: | -- |
Distribution System
| Line Type |
Size Range (Inches) |
Estimated % of lines |
| Cast Iron |
2-12 |
25.00 % |
| Ductile Iron |
2-12 |
25.00 % |
| Polyvinyl Chloride |
2-12 |
50.00 % |
Programs
We have replaced 95% of residential water meters that have leak alert capabilities. We also use acoustic listening devises Water Conservation
Stanley is still in negotiations With Lowell, Ranlo, and Dallas for providing an interconnect. 2. Water Use Information
Service Area
| Sub-Basin(s) | % of Service Population |
|---|
| Catawba River (03-1) | 100 % |
|
| County(s) | % of Service Population |
|---|
| Gaston | 100 % |
|
Water Use by Type
| Type of Use |
Metered
Connections |
Metered
Average Use (MGD) |
Non-Metered
Connections |
Non-Metered
Estimated Use (MGD) |
| Residential |
2,544 |
0.2498 |
0 |
0.0000 |
| Commercial |
164 |
0.0357 |
0 |
0.0000 |
| Industrial |
10 |
0.1834 |
0 |
0.0000 |
| Institutional |
5 |
0.0143 |
0 |
0.0000 |
How much water was used for system processes (backwash, line cleaning, flushing, etc.)? 0.0238 MGD
3. Water Supply Sources
Monthly Withdrawals & Purchases
|
Average Daily
Use (MGD) |
Max Day
Use (MGD) |
|
Average Daily
Use (MGD) |
Max Day
Use (MGD) |
|
Average Daily
Use (MGD) |
Max Day
Use (MGD) |
| Jan |
0.5476 |
|
May |
0.4701 |
|
Sep |
0.5405 |
|
| Feb |
0.5088 |
|
Jun |
0.5833 |
|
Oct |
0.4956 |
|
| Mar |
0.4772 |
|
Jul |
0.6143 |
|
Nov |
0.5189 |
|
| Apr |
0.4851 |
|
Aug |
0.5391 |
|
Dec |
0.5044 |
|
The City of Mt. Holly withdraws water back from the tower to supply a community, the amounts are deducted from Town of Stanley Intake Meter 
Water Purchases From Other Systems
| Seller |
PWSID |
Average
Daily Purchased
(MGD) |
Days
Used |
Contract |
Required to
comply with water
use restrictions? |
Pipe Size(s)
(Inches) |
Use
Type |
| MGD |
Expiration |
Recurring |
| City of Mt. Holly |
01-36-020 |
0.5326 |
366 |
0.6000 |
2070 |
No |
Yes |
12 |
Regular |
In their 2024 LWSP, Mt. Holly has noted that "Review of current water sales agreement with the Town of Stanley shows an agreement beginning in 2005 for 600,000 gallons of water per day. Mount Holly and Stanley are currently negotiating a new agreement for 30 years which shall supersede prior agreements with a 300,000 gallons per day increase up to 900,000 gallons of water per day. If finalized this year -- in 2025, the additional 300,000 gpd in sales will be shown in next year's (2025) LWSP." 4. Wastewater Information
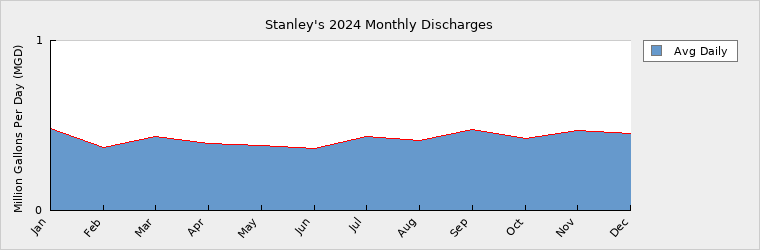
Monthly Discharges
|
Average Daily
Discharge (MGD) |
|
Average Daily
Discharge (MGD) |
|
Average Daily
Discharge (MGD) |
| Jan |
0.4797 |
May |
0.3842 |
Sep |
0.4745 |
| Feb |
0.3683 |
Jun |
0.3628 |
Oct |
0.4216 |
| Mar |
0.4351 |
Jul |
0.4371 |
Nov |
0.4681 |
| Apr |
0.3964 |
Aug |
0.4130 |
Dec |
0.4543 |
Wastewater Interconnections
| Water System |
PWSID |
Type |
Average Daily Amount |
Contract
Maximum (MGD) |
| MGD |
Days Used |
| Two Rivers Utilities |
01-36-010 |
Discharging |
0.4200 |
366 |
1.0000 |
5. Planning
Projections
| |
2024 |
2030 |
2040 |
2050 |
2060 |
2070 |
| Year-Round Population |
4,124 |
4,243 |
4,890 |
5,557 |
6,314 |
7,175 |
| Seasonal Population |
0 |
0 |
0 |
0 |
0 |
0 |
| |
| Residential |
0.2498 |
0.2569 |
0.2960 |
0.3363 |
0.3821 |
0.4341 |
| Commercial |
0.0357 |
0.0367 |
0.0423 |
0.0480 |
0.0546 |
0.0620 |
| Industrial |
0.1834 |
0.1834 |
0.1834 |
0.1834 |
0.1834 |
0.1834 |
| Institutional |
0.0143 |
0.0441 |
0.0508 |
0.0578 |
0.0656 |
0.0746 |
| System Process |
0.0238 |
0.0438 |
0.0438 |
0.0438 |
0.0438 |
0.0438 |
| Unaccounted-for |
0.0256 |
0.0285 |
0.0311 |
0.0338 |
0.0368 |
0.0403 |
Future Supply Sources
| Source Name |
PWSID |
Source Type |
Additional Supply |
Year Online |
Year Offline |
Type |
| Mt. Holly |
01-36-020 |
Purchase |
0.3000 |
2025 |
2070 |
Regular |
Discussions are underway with Mt. Holly to increase Stanley's supply to 0.9000 MGD. A letter from Mt. Holly to Stanley indicates this will be put before their Board in early November 2025. Demand v/s Percent of Supply
| |
2024 |
2030 |
2040 |
2050 |
2060 |
2070 |
| Surface Water Supply |
0.0000 |
0.0000 |
0.0000 |
0.0000 |
0.0000 |
0.0000 |
| Ground Water Supply |
0.0000 |
0.0000 |
0.0000 |
0.0000 |
0.0000 |
0.0000 |
| Purchases |
0.6000 |
0.6000 |
0.6000 |
0.6000 |
0.6000 |
0.6000 |
| Future Supplies |
0.3000 |
0.3000 |
0.3000 |
0.3000 |
0.0000 |
| Total Available Supply (MGD) |
0.6000 |
0.9000 |
0.9000 |
0.9000 |
0.9000 |
0.6000 |
| Service Area Demand |
0.5326 |
0.5934 |
0.6474 |
0.7031 |
0.7663 |
0.8382 |
| Sales |
0.0000 |
0.0000 |
0.0000 |
0.0000 |
0.0000 |
0.0000 |
| Future Sales |
0.0000 |
0.0000 |
0.0000 |
0.0000 |
0.0000 |
| Total Demand (MGD) |
0.5326 |
0.5934 |
0.6474 |
0.7031 |
0.7663 |
0.8382 |
| Demand as Percent of Supply |
89% |
66% |
72% |
78% |
85% |
140% |

The purpose of the above chart is to show a general indication of how the long-term per capita water demand changes over time. The per capita water demand may actually be different than indicated due to seasonal populations and the accuracy of data submitted. Water systems that have calculated long-term per capita water demand based on a methodology that produces different results may submit their information in the notes field.
Your long-term water demand is 61 gallons per capita per day. What demand management practices do you plan to implement to reduce the per capita water demand (i.e. conduct regular water audits, implement a plumbing retrofit program, employ practices such as rainwater harvesting or reclaimed water)? If these practices are covered elsewhere in your plan, indicate where the practices are discussed here.
Currently replacing old aging service lines and 2" lines to reduce leaking water
Are there other demand management practices you will implement to reduce your future supply needs? frequent leak detection
What supplies other than the ones listed in future supplies are being considered to meet your future supply needs?
How does the water system intend to implement the demand management and supply planning components above? we use the help of NC Rural Water
Additional Information
Has this system participated in regional water supply or water use planning? No
What major water supply reports or studies were used for planning?
Please describe any other needs or issues regarding your water supply sources, any water system deficiencies or needed improvements (storage, treatment, etc.) or your ability to meet present and future water needs. Include both quantity and quality considerations, as well as financial, technical, managerial, permitting, and compliance issues:
The Division of Water Resources (DWR) provides the data contained within this
Local Water Supply Plan (LWSP) as a courtesy and service to our customers.
DWR staff does not field verify data. Neither DWR, nor any other party
involved in the preparation of this LWSP attests that the data is completely
free of errors and omissions. Furthermore, data users are cautioned that
LWSPs labeled PROVISIONAL have yet to be reviewed by DWR staff. Subsequent
review may result in significant revision. Questions regarding the accuracy
or limitations of usage of this data should be directed to the water system
and/or DWR.
|