|
The Division of Water Resources (DWR) provides the data contained within this
Local Water Supply Plan (LWSP) as a courtesy and service to our customers.
DWR staff does not field verify data. Neither DWR, nor any other party
involved in the preparation of this LWSP attests that the data is completely
free of errors and omissions. Furthermore, data users are cautioned that
LWSPs labeled PROVISIONAL have yet to be reviewed by DWR staff. Subsequent
review may result in significant revision. Questions regarding the accuracy
or limitations of usage of this data should be directed to the water system
and/or DWR.
1. System Information
Contact Information
Provisional
| Water System Name: |
Maggie Valley SD |
|
PWSID: |
01-44-040 |
| Mailing Address: | P.O. Box 1029
Maggie Valley, NC 28751 | Ownership: | District |
| |
| Contact Person: | JASON P HERBERT | Title: | District Manager |
| Phone: | 828-926-0145 | Cell/Mobile: | 828-734-6988 |
Distribution System
| Line Type |
Size Range (Inches) |
Estimated % of lines |
| Asbestos Cement |
6 |
2.00 % |
| Ductile Iron |
6-16 |
18.00 % |
| Polyvinyl Chloride |
2- 8 |
80.00 % |
For the past 7 years MVSD has replaced all of the residential meters and currently replaced just over 70% of the commercial meters. Programs
Water Conservation
MVSD is interconnected with Waynesville for emergency use only. 2. Water Use Information
Service Area
| Sub-Basin(s) | % of Service Population |
|---|
| Pigeon River (05-3) | 100 % |
|
| County(s) | % of Service Population |
|---|
| Haywood | 100 % |
|
Our system is currently working with McGuill to map out our system. Water Use by Type
| Type of Use |
Metered
Connections |
Metered
Average Use (MGD) |
Non-Metered
Connections |
Non-Metered
Estimated Use (MGD) |
| Residential |
4,131 |
0.5425 |
0 |
0.0000 |
| Commercial |
361 |
0.2987 |
0 |
0.0000 |
| Industrial |
2 |
0.0458 |
0 |
0.0000 |
| Institutional |
9 |
0.0530 |
0 |
0.0000 |
How much water was used for system processes (backwash, line cleaning, flushing, etc.)? 0.1147 MGD
Water Sales
| Purchaser |
PWSID |
Average
Daily Sold
(MGD) |
Days
Used |
Contract |
Required to
comply with water
use restrictions? |
Pipe Size(s)
(Inches) |
Use
Type |
| MGD |
Expiration |
Recurring |
| Junaluska SD |
01-44-035 |
0.0000 |
0 |
0.0000 |
|
Yes |
Yes |
8 |
Emergency |
| Town of Waynesville |
01-44-040 |
0.0000 |
0 |
0.0000 |
|
No |
Yes |
8 |
Emergency |
The inner connection is for emergency use only! 3. Water Supply Sources
Monthly Withdrawals & Purchases
|
Average Daily
Use (MGD) |
Max Day
Use (MGD) |
|
Average Daily
Use (MGD) |
Max Day
Use (MGD) |
|
Average Daily
Use (MGD) |
Max Day
Use (MGD) |
| Jan |
1.1750 |
1.4360 |
May |
1.1770 |
1.4640 |
Sep |
1.1430 |
1.3950 |
| Feb |
1.1910 |
1.4270 |
Jun |
1.2830 |
1.4670 |
Oct |
1.3600 |
1.5330 |
| Mar |
1.1150 |
1.3930 |
Jul |
1.1830 |
1.4320 |
Nov |
1.2710 |
1.4600 |
| Apr |
1.1280 |
1.2580 |
Aug |
1.2290 |
1.3630 |
Dec |
1.3390 |
1.5100 |

Surface Water Sources
| Stream |
Reservoir |
Average Daily Withdrawal |
Maximum Day
Withdrawal (MGD) |
Available Raw
Water Supply |
Usable On-Stream
Raw Water Supply
Storage (MG) |
| MGD |
Days Used |
MGD |
* Qualifier |
| Campbell Creek |
|
1.2290 |
365 |
1.5330 |
1.5000 |
F |
0.0000 |
| Jonathan Creek |
|
0.0000 |
0 |
0.0000 |
3.0000 |
F |
0.0000 |
* Qualifier: C=Contract Amount, SY20=20-year Safe Yield, SY50=50-year Safe Yield, F=20% of 7Q10 or other instream flow requirement, CUA=Capacity Use Area Permit
Surface Water Sources (continued)
| Stream |
Reservoir |
Drainage Area
(sq mi) |
Metered? |
Sub-Basin |
County |
Year
Offline |
Use
Type |
| Campbell Creek |
|
7 |
Yes |
Pigeon River (05-3) |
Haywood |
|
Regular |
| Jonathan Creek |
|
14 |
Yes |
Pigeon River (05-3) |
Haywood |
|
Regular |
Water Purchases From Other Systems
| Seller |
PWSID |
Average
Daily Purchased
(MGD) |
Days
Used |
Contract |
Required to
comply with water
use restrictions? |
Pipe Size(s)
(Inches) |
Use
Type |
| MGD |
Expiration |
Recurring |
| Waynesville |
01-44-010 |
0.0000 |
0 |
0.5000 |
2020 |
Yes |
Yes |
8 |
Emergency |
Water Treatment Plants
| Plant Name |
Permitted Capacity
(MGD) |
Is Raw Water Metered? |
Is Finished Water Ouput Metered? |
Source |
| Maggie Valley Water Treatment |
3.0000 |
Yes |
Yes |
Campbell Creek/Jonathan Creek |
4. Wastewater Information
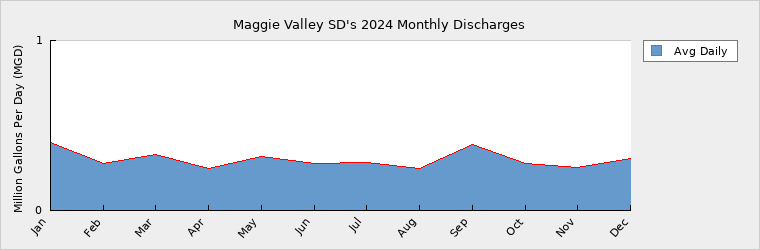
Monthly Discharges
|
Average Daily
Discharge (MGD) |
|
Average Daily
Discharge (MGD) |
|
Average Daily
Discharge (MGD) |
| Jan |
0.4272 |
May |
0.3422 |
Sep |
0.4142 |
| Feb |
0.3032 |
Jun |
0.3012 |
Oct |
0.3032 |
| Mar |
0.3562 |
Jul |
0.3122 |
Nov |
0.2792 |
| Apr |
0.2722 |
Aug |
0.2722 |
Dec |
0.3342 |
Wastewater Permits
| Permit Number |
Type |
Permitted Capacity
(MGD) |
Design Capacity
(MGD) |
Average Annual
Daily Discharge
(MGD) |
Maximum Day Discharge
(MGD) |
Receiving Stream |
Receiving Basin |
| NC0056561 |
WWTP |
1.0000 |
1.0000 |
0.3000 |
2.1000 |
Jonathan Creek |
Pigeon River (05-3) |
| WQ0010615 |
CS |
0.0000 |
0.0000 |
0.0000 |
0.0000 |
Jonathan Creek |
Pigeon River (05-3) |
Wastewater Interconnections
| Water System |
PWSID |
Type |
Average Daily Amount |
Contract
Maximum (MGD) |
| MGD |
Days Used |
| Waynesville |
01-44-010 |
Discharging |
0.0272 |
365 |
|
5. Planning
Projections
| |
2024 |
2030 |
2040 |
2050 |
2060 |
2070 |
| Year-Round Population |
9,629 |
9,710 |
9,755 |
9,805 |
9,860 |
9,901 |
| Seasonal Population |
0 |
0 |
0 |
0 |
0 |
0 |
| |
| Residential |
0.5425 |
0.5389 |
0.5414 |
0.5442 |
0.5472 |
0.5495 |
| Commercial |
0.2987 |
0.2850 |
0.3105 |
0.3225 |
0.3397 |
0.3472 |
| Industrial |
0.0458 |
0.0325 |
0.0395 |
0.0465 |
0.0510 |
0.0525 |
| Institutional |
0.0530 |
0.0525 |
0.0529 |
0.0537 |
0.0548 |
0.0562 |
| System Process |
0.1147 |
0.1589 |
0.1665 |
0.1715 |
0.2075 |
0.2194 |
| Unaccounted-for |
0.1709 |
0.2281 |
0.2323 |
0.2385 |
0.2409 |
0.2436 |
Demand v/s Percent of Supply
| |
2024 |
2030 |
2040 |
2050 |
2060 |
2070 |
| Surface Water Supply |
4.5000 |
4.5000 |
4.5000 |
4.5000 |
4.5000 |
4.5000 |
| Ground Water Supply |
0.0000 |
0.0000 |
0.0000 |
0.0000 |
0.0000 |
0.0000 |
| Purchases |
0.0000 |
0.0000 |
0.0000 |
0.0000 |
0.0000 |
0.0000 |
| Future Supplies |
0.0000 |
0.0000 |
0.0000 |
0.0000 |
0.0000 |
| Total Available Supply (MGD) |
4.5000 |
4.5000 |
4.5000 |
4.5000 |
4.5000 |
4.5000 |
| Service Area Demand |
1.2256 |
1.2959 |
1.3431 |
1.3769 |
1.4411 |
1.4684 |
| Sales |
0.0000 |
0.0000 |
0.0000 |
0.0000 |
0.0000 |
0.0000 |
| Future Sales |
0.0000 |
0.0000 |
0.0000 |
0.0000 |
0.0000 |
| Total Demand (MGD) |
1.2256 |
1.2959 |
1.3431 |
1.3769 |
1.4411 |
1.4684 |
| Demand as Percent of Supply |
27% |
29% |
30% |
31% |
32% |
33% |

The purpose of the above chart is to show a general indication of how the long-term per capita water demand changes over time. The per capita water demand may actually be different than indicated due to seasonal populations and the accuracy of data submitted. Water systems that have calculated long-term per capita water demand based on a methodology that produces different results may submit their information in the notes field.
Your long-term water demand is 56 gallons per capita per day. What demand management practices do you plan to implement to reduce the per capita water demand (i.e. conduct regular water audits, implement a plumbing retrofit program, employ practices such as rainwater harvesting or reclaimed water)? If these practices are covered elsewhere in your plan, indicate where the practices are discussed here.
With the new AMR's we are able to monitor customer leaks and respond to the customers much quicker. Also, we have been proactive in getting the commercial AMR's changed out.
Are there other demand management practices you will implement to reduce your future supply needs? Continuing to replace older water lines in our system.
What supplies other than the ones listed in future supplies are being considered to meet your future supply needs? The sanitary district has been in contact with property owners about possible well sites.
How does the water system intend to implement the demand management and supply planning components above? We continue to update our CIP and a Board of Directors who are engaged with future planning.
Additional Information
Has this system participated in regional water supply or water use planning? Yes, MVSD and all other water systems in Haywood County are continuing with on going meetings to look at future Source Water needs and reliability of existing interconnections.
What major water supply reports or studies were used for planning? MVSD stream studies by Fish and Wildlife Association and McGuill Associates study of local water supplies
Please describe any other needs or issues regarding your water supply sources, any water system deficiencies or needed improvements (storage, treatment, etc.) or your ability to meet present and future water needs. Include both quantity and quality considerations, as well as financial, technical, managerial, permitting, and compliance issues: MVSD continues to work on acquiring property to protect water shed for the MVSD. Currently the District ownes 7458 acres in the water shed. We will continue to build relaionships with property owners within the water shed to preserve the land and water.
The Division of Water Resources (DWR) provides the data contained within this
Local Water Supply Plan (LWSP) as a courtesy and service to our customers.
DWR staff does not field verify data. Neither DWR, nor any other party
involved in the preparation of this LWSP attests that the data is completely
free of errors and omissions. Furthermore, data users are cautioned that
LWSPs labeled PROVISIONAL have yet to be reviewed by DWR staff. Subsequent
review may result in significant revision. Questions regarding the accuracy
or limitations of usage of this data should be directed to the water system
and/or DWR.
|