|
The Division of Water Resources (DWR) provides the data contained within this
Local Water Supply Plan (LWSP) as a courtesy and service to our customers.
DWR staff does not field verify data. Neither DWR, nor any other party
involved in the preparation of this LWSP attests that the data is completely
free of errors and omissions. Furthermore, data users are cautioned that
LWSPs labeled PROVISIONAL have yet to be reviewed by DWR staff. Subsequent
review may result in significant revision. Questions regarding the accuracy
or limitations of usage of this data should be directed to the water system
and/or DWR.
1. System Information
Contact Information
Complete
| Water System Name: |
Marion |
|
PWSID: |
01-56-010 |
| Mailing Address: | P.O. Drawer 700
Marion, NC 28752 | Ownership: | Municipality |
| |
| Contact Person: | Christopher Nanney | Title: | Water Treatment Plant Superintenden |
| Phone: | 828-652-2428 | Cell/Mobile: | -- |
| |
| Secondary Contact: | Brant Sikes | | Phone: | 828-652-4224 |
| Mailing Address: | Po Drawer 700
Marion, NC 28752 | Cell/Mobile: | -- |
Distribution System
| Line Type |
Size Range (Inches) |
Estimated % of lines |
| Asbestos Cement |
4-10 |
3.00 % |
| Cast Iron |
4-16 |
35.00 % |
| Ductile Iron |
6-24 |
31.00 % |
| Galvanized Iron |
2 |
1.00 % |
| Polyvinyl Chloride |
2-12 |
30.00 % |
Programs
Water production totals at the Water Treatment Plant are compared with water collection totals in the distribution system on a monthly basis. Total water used for filter backwashes, basin cleanings, known unmetered water and water used by the Waste Water Treatment Plant for feeding Cl2 and So2 are also calculated and accounted for on a monthly basis. When discrepancies are noted, Public Works is notified and a work order is created to locate and repair all detectable leaks. The City staff continue to analyze data and make repairs and improvements in our system to maximize efficiency. Water Conservation
There are no systems close enough that are financially within reason. 2. Water Use Information
Service Area
| Sub-Basin(s) | % of Service Population |
|---|
| Catawba River (03-1) | 100 % |
|
| County(s) | % of Service Population |
|---|
| McDowell | 100 % |
|
Water Use by Type
| Type of Use |
Metered
Connections |
Metered
Average Use (MGD) |
Non-Metered
Connections |
Non-Metered
Estimated Use (MGD) |
| Residential |
3,718 |
0.4549 |
0 |
0.0000 |
| Commercial |
697 |
0.4700 |
0 |
0.0000 |
| Industrial |
27 |
0.0260 |
0 |
0.0000 |
| Institutional |
0 |
0.0000 |
0 |
0.0000 |
How much water was used for system processes (backwash, line cleaning, flushing, etc.)? 0.1960 MGD
Water Sales
| Purchaser |
PWSID |
Average
Daily Sold
(MGD) |
Days
Used |
Contract |
Required to
comply with water
use restrictions? |
Pipe Size(s)
(Inches) |
Use
Type |
| MGD |
Expiration |
Recurring |
| Nebo |
10-56-032 |
0.0640 |
366 |
0.2000 |
2027 |
Yes |
Yes |
12 |
Regular |
3. Water Supply Sources
Monthly Withdrawals & Purchases
|
Average Daily
Use (MGD) |
Max Day
Use (MGD) |
|
Average Daily
Use (MGD) |
Max Day
Use (MGD) |
|
Average Daily
Use (MGD) |
Max Day
Use (MGD) |
| Jan |
1.6577 |
2.4020 |
May |
1.6719 |
2.8400 |
Sep |
1.5670 |
2.8830 |
| Feb |
1.5228 |
2.1000 |
Jun |
1.5480 |
1.9210 |
Oct |
1.9318 |
2.2800 |
| Mar |
1.4929 |
1.9320 |
Jul |
1.5934 |
1.7490 |
Nov |
1.5632 |
1.8140 |
| Apr |
1.4615 |
1.6550 |
Aug |
1.6469 |
1.9730 |
Dec |
1.5672 |
2.0710 |

Surface Water Sources
| Stream |
Reservoir |
Average Daily Withdrawal |
Maximum Day
Withdrawal (MGD) |
Available Raw
Water Supply |
Usable On-Stream
Raw Water Supply
Storage (MG) |
| MGD |
Days Used |
MGD |
* Qualifier |
| Buck Creek |
Buck Creek Intake |
0.9810 |
366 |
1.8800 |
3.0000 |
F |
0.0000 |
| Clear Creek |
Clear Creek Intake |
0.2110 |
366 |
0.4000 |
0.4000 |
F |
0.0000 |
| Mackey Creek |
Mackey Creek Intake |
0.4100 |
366 |
0.6000 |
0.9000 |
F |
0.0000 |
* Qualifier: C=Contract Amount, SY20=20-year Safe Yield, SY50=50-year Safe Yield, F=20% of 7Q10 or other instream flow requirement, CUA=Capacity Use Area Permit
Surface Water Sources (continued)
| Stream |
Reservoir |
Drainage Area
(sq mi) |
Metered? |
Sub-Basin |
County |
Year
Offline |
Use
Type |
| Buck Creek |
Buck Creek Intake |
26 |
Yes |
Catawba River (03-1) |
McDowell |
|
Regular |
| Clear Creek |
Clear Creek Intake |
1 |
Yes |
Catawba River (03-1) |
McDowell |
|
Regular |
| Mackey Creek |
Mackey Creek Intake |
3 |
Yes |
Catawba River (03-1) |
McDowell |
|
Regular |
During times of extreme drought Mackey and Clear Creek Intakes are bypassed as necessary to maintain minimum flow for the protection of downstream ecology. Water Treatment Plants
| Plant Name |
Permitted Capacity
(MGD) |
Is Raw Water Metered? |
Is Finished Water Ouput Metered? |
Source |
| Marion Water Treatment Plant |
4.0000 |
Yes |
Yes |
Mackey Creek, Clear Creek, Buck creek |
4. Wastewater Information
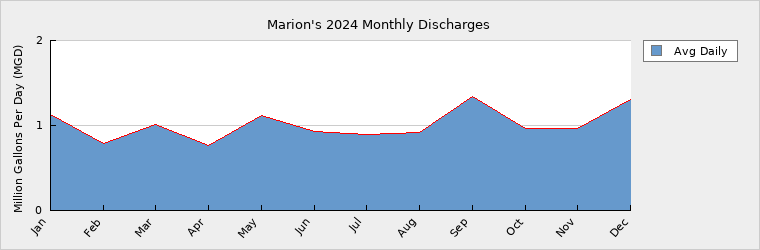
Monthly Discharges
|
Average Daily
Discharge (MGD) |
|
Average Daily
Discharge (MGD) |
|
Average Daily
Discharge (MGD) |
| Jan |
1.1240 |
May |
1.1230 |
Sep |
1.3400 |
| Feb |
0.7860 |
Jun |
0.9310 |
Oct |
0.9610 |
| Mar |
1.0070 |
Jul |
0.8940 |
Nov |
0.9610 |
| Apr |
0.7690 |
Aug |
0.9210 |
Dec |
1.3050 |
Wastewater Permits
| Permit Number |
Type |
Permitted Capacity
(MGD) |
Design Capacity
(MGD) |
Average Annual
Daily Discharge
(MGD) |
Maximum Day Discharge
(MGD) |
Receiving Stream |
Receiving Basin |
| NC0031879 |
WWTP |
3.0000 |
3.0000 |
1.0000 |
8.1000 |
Muddy Creek |
Catawba River (03-1) |
| NCG590032 |
WTP |
0.0500 |
4.0000 |
0.0088 |
|
Nicks Creek |
Catawba River (03-1) |
5. Planning
Projections
| |
2024 |
2030 |
2040 |
2050 |
2060 |
2070 |
| Year-Round Population |
9,363 |
9,500 |
9,595 |
9,690 |
9,790 |
9,885 |
| Seasonal Population |
0 |
0 |
0 |
0 |
0 |
0 |
| |
| Residential |
0.4549 |
0.4655 |
0.4702 |
0.4749 |
0.4796 |
0.4844 |
| Commercial |
0.4700 |
0.4746 |
0.4792 |
0.4838 |
0.4884 |
0.4930 |
| Industrial |
0.0260 |
0.0265 |
0.0270 |
0.0275 |
0.0280 |
0.0285 |
| Institutional |
0.0000 |
0.0000 |
0.0000 |
0.0000 |
0.0000 |
0.0000 |
| System Process |
0.1960 |
0.2200 |
0.2220 |
0.2240 |
0.2260 |
0.2280 |
| Unaccounted-for |
0.3911 |
0.4046 |
0.4087 |
0.4127 |
0.4167 |
0.4208 |
Demand v/s Percent of Supply
| |
2024 |
2030 |
2040 |
2050 |
2060 |
2070 |
| Surface Water Supply |
4.3000 |
4.3000 |
4.3000 |
4.3000 |
4.3000 |
4.3000 |
| Ground Water Supply |
0.0000 |
0.0000 |
0.0000 |
0.0000 |
0.0000 |
0.0000 |
| Purchases |
0.0000 |
0.0000 |
0.0000 |
0.0000 |
0.0000 |
0.0000 |
| Future Supplies |
0.0000 |
0.0000 |
0.0000 |
0.0000 |
0.0000 |
| Total Available Supply (MGD) |
4.3000 |
4.3000 |
4.3000 |
4.3000 |
4.3000 |
4.3000 |
| Service Area Demand |
1.5380 |
1.5912 |
1.6071 |
1.6229 |
1.6387 |
1.6547 |
| Sales |
0.0640 |
0.2000 |
0.2000 |
0.2000 |
0.2000 |
0.2000 |
| Future Sales |
0.0000 |
0.0000 |
0.0000 |
0.0000 |
0.0000 |
| Total Demand (MGD) |
1.6020 |
1.7912 |
1.8071 |
1.8229 |
1.8387 |
1.8547 |
| Demand as Percent of Supply |
37% |
42% |
42% |
42% |
43% |
43% |

The purpose of the above chart is to show a general indication of how the long-term per capita water demand changes over time. The per capita water demand may actually be different than indicated due to seasonal populations and the accuracy of data submitted. Water systems that have calculated long-term per capita water demand based on a methodology that produces different results may submit their information in the notes field.
Your long-term water demand is 49 gallons per capita per day. What demand management practices do you plan to implement to reduce the per capita water demand (i.e. conduct regular water audits, implement a plumbing retrofit program, employ practices such as rainwater harvesting or reclaimed water)? If these practices are covered elsewhere in your plan, indicate where the practices are discussed here.
Are there other demand management practices you will implement to reduce your future supply needs?
What supplies other than the ones listed in future supplies are being considered to meet your future supply needs?
How does the water system intend to implement the demand management and supply planning components above?
Additional Information
Has this system participated in regional water supply or water use planning? No
What major water supply reports or studies were used for planning?
Please describe any other needs or issues regarding your water supply sources, any water system deficiencies or needed improvements (storage, treatment, etc.) or your ability to meet present and future water needs. Include both quantity and quality considerations, as well as financial, technical, managerial, permitting, and compliance issues:
The Division of Water Resources (DWR) provides the data contained within this
Local Water Supply Plan (LWSP) as a courtesy and service to our customers.
DWR staff does not field verify data. Neither DWR, nor any other party
involved in the preparation of this LWSP attests that the data is completely
free of errors and omissions. Furthermore, data users are cautioned that
LWSPs labeled PROVISIONAL have yet to be reviewed by DWR staff. Subsequent
review may result in significant revision. Questions regarding the accuracy
or limitations of usage of this data should be directed to the water system
and/or DWR.
|