|
The Division of Water Resources (DWR) provides the data contained within this
Local Water Supply Plan (LWSP) as a courtesy and service to our customers.
DWR staff does not field verify data. Neither DWR, nor any other party
involved in the preparation of this LWSP attests that the data is completely
free of errors and omissions. Furthermore, data users are cautioned that
LWSPs labeled PROVISIONAL have yet to be reviewed by DWR staff. Subsequent
review may result in significant revision. Questions regarding the accuracy
or limitations of usage of this data should be directed to the water system
and/or DWR.
1. System Information
Contact Information
Provisional
| Water System Name: |
Hot Springs |
|
PWSID: |
01-58-020 |
| Mailing Address: | PO Box 218
Hot Springs, NC 28743 | Ownership: | Municipality |
| |
| Contact Person: | Justin Wood | Title: | Back Up ORC |
| Phone: | 828-206-5355 | Cell/Mobile: | -- |
| |
| Secondary Contact: | Jordan Jackson | | Phone: | 336-596-3805 |
| Mailing Address: |
, | Cell/Mobile: | -- |
Distribution System
| Line Type |
Size Range (Inches) |
Estimated % of lines |
| Galvanized Iron |
3/4-2 |
45.00 % |
| Polyvinyl Chloride |
3/4-8 |
55.00 % |
Town has 2 storage tanks. One is 0.5 MG and the other is 0.2 MG. Hurricane Helene devastated the area, but the water system held up well. Wells were at a high elevation to not be under water. Generator was utilized for power outage. Programs
Fix leaks as discovered. If leak is not discovered we call NCRWA to locate it. Water Conservation
2. Water Use Information
Service Area
| Sub-Basin(s) | % of Service Population |
|---|
| French Broad River (05-2) | 100 % |
|
| County(s) | % of Service Population |
|---|
| Madison | 100 % |
|
Water Use by Type
| Type of Use |
Metered
Connections |
Metered
Average Use (MGD) |
Non-Metered
Connections |
Non-Metered
Estimated Use (MGD) |
| Residential |
326 |
0.0968 |
25 |
0.0074 |
| Commercial |
32 |
0.0182 |
0 |
0.0000 |
| Industrial |
0 |
0.0000 |
0 |
0.0000 |
| Institutional |
0 |
0.0000 |
0 |
0.0000 |
How much water was used for system processes (backwash, line cleaning, flushing, etc.)? 0.0002 MGD
This data seems very questionable. All hard copy records were destroyed by Hurricane Helene. Customer numbers vary greatly from the 2023 numbers and consumption does too. Billing is done every 2 months which makes it a slower process for the billing software to get good data. Additionally, The Hurricane's impact meant that many months did not have meter readings. 3. Water Supply Sources
Monthly Withdrawals & Purchases
|
Average Daily
Use (MGD) |
Max Day
Use (MGD) |
|
Average Daily
Use (MGD) |
Max Day
Use (MGD) |
|
Average Daily
Use (MGD) |
Max Day
Use (MGD) |
| Jan |
0.1542 |
|
May |
0.1380 |
|
Sep |
0.1264 |
|
| Feb |
0.1649 |
|
Jun |
0.1826 |
|
Oct |
0.0953 |
|
| Mar |
0.1542 |
|
Jul |
0.1790 |
|
Nov |
0.1663 |
|
| Apr |
0.1594 |
|
Aug |
0.1613 |
|
Dec |
0.2004 |
|
Meter was replaced in Feb/March 2024. Contract operator also changed in March 2024. March 2024 MOR is unreadable. 
Ground Water Sources
| Name or Number |
Average Daily Withdrawal (MGD) |
Max Day Withdrawal (MGD) |
12-Hour Supply
(MGD) |
CUA Reduction |
Year Offline |
Use Type |
| MGD |
Days Used |
| 01 |
0.1568 |
366 |
0.185 |
0.2300 |
|
|
Regular |
| 02 |
0.0549 |
35 |
0.200 |
0.0650 |
|
|
Regular |
Ground Water Sources (continued)
| Name or Number |
Well Depth (Feet) |
Casing Depth
(Feet) |
Screen Depth (Feet) |
Well Diameter (Inches) |
Pump Intake Depth (Feet) |
Metered? |
| Top |
Bottom |
| 01 |
200 |
150 |
0 |
0 |
6 |
120 |
Yes |
| 02 |
150 |
100 |
0 |
0 |
4 |
120 |
Yes |
Water Treatment Plants
| Plant Name |
Permitted Capacity
(MGD) |
Is Raw Water Metered? |
Is Finished Water Ouput Metered? |
Source |
| Town of Hot Springs |
0.2500 |
Yes |
Yes |
well# 1 and 2 |
4. Wastewater Information
Monthly Discharges
|
Average Daily
Discharge (MGD) |
|
Average Daily
Discharge (MGD) |
|
Average Daily
Discharge (MGD) |
| Jan |
0.1020 |
May |
0.5960 |
Sep |
0.2770 |
| Feb |
0.0930 |
Jun |
0.2280 |
Oct |
0.1090 |
| Mar |
0.1720 |
Jul |
0.0620 |
Nov |
0.0810 |
| Apr |
0.2490 |
Aug |
0.2270 |
Dec |
0.0860 |
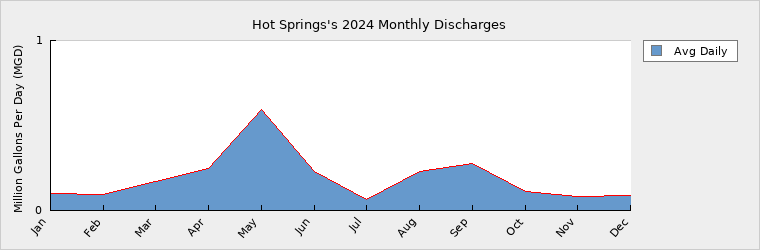
Hot Springs just received confirmation for funding for new WWTP. Its permitted capacity will be 1.75MG. Until the new plant is constructed, They will operate with 2 package plants (each is .75 MG capacity), they should be in operation first half of 2025. New effluent metering will be a great part of these projects. Wastewater Permits
| Permit Number |
Type |
Permitted Capacity
(MGD) |
Design Capacity
(MGD) |
Average Annual
Daily Discharge
(MGD) |
Maximum Day Discharge
(MGD) |
Receiving Stream |
Receiving Basin |
| NC0025836 |
WWTP |
0.8000 |
0.8000 |
0.1900 |
1.0000 |
French Broad |
French Broad River (05-2) |
| NC0049620 |
WWTP |
0.0100 |
0.0100 |
0.0010 |
0.0020 |
French Broad |
French Broad River (05-2) |
NC0049620 is sand filter and treats ww from 40 Housing Authority units. Hurricane Helene destroyed it and it was replaced March 2025.
NC0025836 is the main WWTP for Hot Springs. Hurricane Helene damaged the plant significantly. The town is working hard to get temporary package plants in place in the next couple of months. 5. Planning
Projections
| |
2024 |
2030 |
2040 |
2050 |
2060 |
2070 |
| Year-Round Population |
650 |
650 |
650 |
650 |
650 |
650 |
| Seasonal Population |
1,500 |
1,600 |
1,700 |
1,800 |
1,900 |
2,000 |
| |
| Residential |
0.1042 |
0.1100 |
0.1100 |
0.1100 |
0.1100 |
0.1100 |
| Commercial |
0.0182 |
0.0500 |
0.0600 |
0.0700 |
0.0800 |
0.0900 |
| Industrial |
0.0000 |
0.0000 |
0.0000 |
0.0000 |
0.0000 |
0.0000 |
| Institutional |
0.0000 |
0.0010 |
0.0010 |
0.0010 |
0.0010 |
0.0010 |
| System Process |
0.0002 |
0.0002 |
0.0002 |
0.0002 |
0.0002 |
0.0002 |
| Unaccounted-for |
0.0395 |
0.1101 |
0.1170 |
0.1238 |
0.1306 |
0.1374 |
Billing is done on 2 month cycle. Meter readings in 2025 will be the first since the hurricane hit. As system continues to use billing software, the town will have a better idea of water that is produced vs. sold.
Vacation homes in Hot Springs are classified as a business. Future Water Sales
| Purchaser |
PWSID |
Contract |
Pipe Size(s) (Inches) |
Use Type |
| MGD |
Year Begin |
Year End |
| Fairview Water Assoc |
01-58-025 |
0.0000 |
2025 |
|
|
Regular |
The County is working to put in an interconnection. I am unaware of the volume of water the system will use, so I put 0. Demand v/s Percent of Supply
| |
2024 |
2030 |
2040 |
2050 |
2060 |
2070 |
| Surface Water Supply |
0.0000 |
0.0000 |
0.0000 |
0.0000 |
0.0000 |
0.0000 |
| Ground Water Supply |
0.2950 |
0.2950 |
0.2950 |
0.2950 |
0.2950 |
0.2950 |
| Purchases |
0.0000 |
0.0000 |
0.0000 |
0.0000 |
0.0000 |
0.0000 |
| Future Supplies |
0.0000 |
0.0000 |
0.0000 |
0.0000 |
0.0000 |
| Total Available Supply (MGD) |
0.2950 |
0.2950 |
0.2950 |
0.2950 |
0.2950 |
0.2950 |
| Service Area Demand |
0.1621 |
0.2713 |
0.2882 |
0.3050 |
0.3218 |
0.3386 |
| Sales |
0.0000 |
0.0000 |
0.0000 |
0.0000 |
0.0000 |
0.0000 |
| Future Sales |
0.0000 |
0.0000 |
0.0000 |
0.0000 |
0.0000 |
| Total Demand (MGD) |
0.1621 |
0.2713 |
0.2882 |
0.3050 |
0.3218 |
0.3386 |
| Demand as Percent of Supply |
55% |
92% |
98% |
103% |
109% |
115% |

The purpose of the above chart is to show a general indication of how the long-term per capita water demand changes over time. The per capita water demand may actually be different than indicated due to seasonal populations and the accuracy of data submitted. Water systems that have calculated long-term per capita water demand based on a methodology that produces different results may submit their information in the notes field.
Your long-term water demand is 160 gallons per capita per day. What demand management practices do you plan to implement to reduce the per capita water demand (i.e. conduct regular water audits, implement a plumbing retrofit program, employ practices such as rainwater harvesting or reclaimed water)? If these practices are covered elsewhere in your plan, indicate where the practices are discussed here.
At this time, the billing software data does not seem accurate, therefore all calculations in this worksheet are not trustworthy. As the system recovers from the impacts of Hurricane Helene, the system will have better data.
Additionally the system is training up a town employee to become certified to operate the water system. When the operator is certified, the town should have better understanding of the operation of their water system.
Are there other demand management practices you will implement to reduce your future supply needs?
What supplies other than the ones listed in future supplies are being considered to meet your future supply needs? At this time, Hot Springs has 2 wells and provides the majority of the water system demand with well 001. If demand increases, the town can use well 002 more.
How does the water system intend to implement the demand management and supply planning components above?
Additional Information
Has this system participated in regional water supply or water use planning? No
What major water supply reports or studies were used for planning?
Please describe any other needs or issues regarding your water supply sources, any water system deficiencies or needed improvements (storage, treatment, etc.) or your ability to meet present and future water needs. Include both quantity and quality considerations, as well as financial, technical, managerial, permitting, and compliance issues:
The Division of Water Resources (DWR) provides the data contained within this
Local Water Supply Plan (LWSP) as a courtesy and service to our customers.
DWR staff does not field verify data. Neither DWR, nor any other party
involved in the preparation of this LWSP attests that the data is completely
free of errors and omissions. Furthermore, data users are cautioned that
LWSPs labeled PROVISIONAL have yet to be reviewed by DWR staff. Subsequent
review may result in significant revision. Questions regarding the accuracy
or limitations of usage of this data should be directed to the water system
and/or DWR.
|