|
The Division of Water Resources (DWR) provides the data contained within this
Local Water Supply Plan (LWSP) as a courtesy and service to our customers.
DWR staff does not field verify data. Neither DWR, nor any other party
involved in the preparation of this LWSP attests that the data is completely
free of errors and omissions. Furthermore, data users are cautioned that
LWSPs labeled PROVISIONAL have yet to be reviewed by DWR staff. Subsequent
review may result in significant revision. Questions regarding the accuracy
or limitations of usage of this data should be directed to the water system
and/or DWR.
1. System Information
Contact Information
Provisional
| Water System Name: |
Albemarle |
|
PWSID: |
01-84-010 |
| Mailing Address: | PO Box 190
Albemarle, NC 28002-0190 | Ownership: | Municipality |
| |
| Contact Person: | Bryan Hinson | Title: | Collection and Distribution Supt |
| Phone: | 704-961-6149 | Cell/Mobile: | 704-961-6149 |
Distribution System
| Line Type |
Size Range (Inches) |
Estimated % of lines |
| Asbestos Cement |
6-16 |
1.00 % |
| Cast Iron |
6-24 |
30.00 % |
| Ductile Iron |
4-30 |
64.00 % |
| Galvanized Iron |
2 |
1.00 % |
| Other |
20-24 |
2.00 % |
| Polyvinyl Chloride |
2-8 |
2.00 % |
Programs
Water Conservation
The City of Albemarle operates two water treatment plants on different bodies of water. 2. Water Use Information
Service Area
| Sub-Basin(s) | % of Service Population |
|---|
| Yadkin River (18-1) | 100 % |
|
| County(s) | % of Service Population |
|---|
| Stanly | 100 % |
|
Water Use by Type
| Type of Use |
Metered
Connections |
Metered
Average Use (MGD) |
Non-Metered
Connections |
Non-Metered
Estimated Use (MGD) |
| Residential |
6,731 |
0.9980 |
0 |
0.0000 |
| Commercial |
1,065 |
1.0400 |
0 |
0.0000 |
| Industrial |
21 |
0.1050 |
0 |
0.0000 |
| Institutional |
0 |
0.0000 |
0 |
0.0000 |
How much water was used for system processes (backwash, line cleaning, flushing, etc.)? 0.2920 MGD
Water Sales
| Purchaser |
PWSID |
Average
Daily Sold
(MGD) |
Days
Used |
Contract |
Required to
comply with water
use restrictions? |
Pipe Size(s)
(Inches) |
Use
Type |
| MGD |
Expiration |
Recurring |
| City of Concord |
01-13-010 |
4.4350 |
365 |
5.0000 |
2035 |
Yes |
Yes |
30 |
Regular |
| Pfeiffer-North Stanly Water |
01-84-025 |
0.5490 |
365 |
0.7500 |
2044 |
Yes |
Yes |
12 |
Regular |
| Stanly County |
01-84-035 |
2.6000 |
365 |
3.0000 |
2016 |
Yes |
Yes |
12 |
Regular |
Adjusted sales to Pfeiffer-North Stanly Water to 0.5490 MGD which aligns with the amount of water they purchased each month in 2024. 3. Water Supply Sources
Monthly Withdrawals & Purchases
|
Average Daily
Use (MGD) |
Max Day
Use (MGD) |
|
Average Daily
Use (MGD) |
Max Day
Use (MGD) |
|
Average Daily
Use (MGD) |
Max Day
Use (MGD) |
| Jan |
9.9700 |
12.1200 |
May |
10.3500 |
11.6400 |
Sep |
10.6600 |
12.5100 |
| Feb |
9.9700 |
11.8200 |
Jun |
10.5700 |
12.2700 |
Oct |
10.4200 |
11.8100 |
| Mar |
9.8800 |
10.5600 |
Jul |
10.1100 |
11.4000 |
Nov |
10.0500 |
11.6500 |
| Apr |
10.2600 |
11.6400 |
Aug |
10.7300 |
11.5500 |
Dec |
9.9100 |
11.0800 |

Surface Water Sources
| Stream |
Reservoir |
Average Daily Withdrawal |
Maximum Day
Withdrawal (MGD) |
Available Raw
Water Supply |
Usable On-Stream
Raw Water Supply
Storage (MG) |
| MGD |
Days Used |
MGD |
* Qualifier |
| Yadkin River |
Tuckertown |
5.4500 |
365 |
6.4300 |
9.0000 |
C |
40.0000 |
| Yadkin River at Narrows |
Narrows (Badin Lake) |
4.7800 |
365 |
6.2600 |
11.0000 |
C |
11.0000 |
* Qualifier: C=Contract Amount, SY20=20-year Safe Yield, SY50=50-year Safe Yield, F=20% of 7Q10 or other instream flow requirement, CUA=Capacity Use Area Permit
Surface Water Sources (continued)
| Stream |
Reservoir |
Drainage Area
(sq mi) |
Metered? |
Sub-Basin |
County |
Year
Offline |
Use
Type |
| Yadkin River |
Tuckertown |
4,080 |
Yes |
Yadkin River (18-1) |
Stanly |
|
Regular |
| Yadkin River at Narrows |
Narrows (Badin Lake) |
4,180 |
Yes |
Yadkin River (18-1) |
Stanly |
|
Regular |
Water Treatment Plants
| Plant Name |
Permitted Capacity
(MGD) |
Is Raw Water Metered? |
Is Finished Water Ouput Metered? |
Source |
| Jack F Neel Water Treatment Pl |
6.5000 |
Yes |
Yes |
Yadkin River - Tuckertown Reservoir |
| US 52 HWY Water Treatment Plan |
12.0000 |
Yes |
Yes |
Yadkin River - Narrows Reservoir (Badin Lake) |
4. Wastewater Information
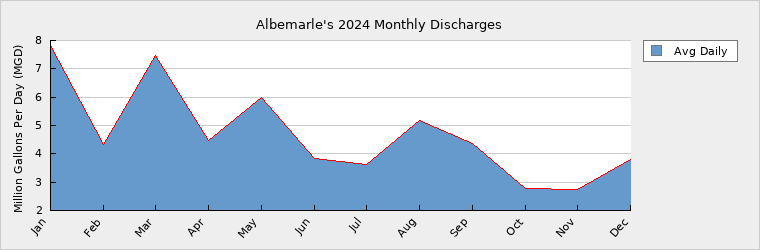
Monthly Discharges
|
Average Daily
Discharge (MGD) |
|
Average Daily
Discharge (MGD) |
|
Average Daily
Discharge (MGD) |
| Jan |
7.8300 |
May |
5.9800 |
Sep |
4.3700 |
| Feb |
4.3300 |
Jun |
3.8200 |
Oct |
2.7900 |
| Mar |
7.4700 |
Jul |
3.6300 |
Nov |
2.7300 |
| Apr |
4.4800 |
Aug |
5.1800 |
Dec |
3.7900 |
Wastewater Permits
| Permit Number |
Type |
Permitted Capacity
(MGD) |
Design Capacity
(MGD) |
Average Annual
Daily Discharge
(MGD) |
Maximum Day Discharge
(MGD) |
Receiving Stream |
Receiving Basin |
| NC0024244 |
WWTP |
12.0000 |
12.0000 |
4.6999 |
18.7200 |
Long Creek |
Rocky River (18-4) |
| NC0044024 |
WTP |
10.0000 |
12.0000 |
1890.0000 |
0.3290 |
Little Long Creek |
Rocky River (18-4) |
| NC0075701 |
WTP |
6.5000 |
8.0000 |
0.1389 |
0.6300 |
Tuckertown Reservoir |
Yadkin River (18-1) |
Wastewater Interconnections
| Water System |
PWSID |
Type |
Average Daily Amount |
Contract
Maximum (MGD) |
| MGD |
Days Used |
| New London |
01-84-025 |
Receiving |
0.0440 |
365 |
|
| Stanly County |
01-84-035 |
Receiving |
0.1300 |
365 |
0.3290 |
5. Planning
Projections
| |
2024 |
2030 |
2040 |
2050 |
2060 |
2070 |
| Year-Round Population |
17,379 |
19,325 |
22,417 |
26,003 |
30,643 |
35,545 |
| Seasonal Population |
0 |
0 |
0 |
0 |
0 |
0 |
| |
| Residential |
0.9980 |
1.5000 |
1.5200 |
1.5600 |
1.7000 |
1.8200 |
| Commercial |
1.0400 |
1.8000 |
1.8200 |
1.8700 |
2.1000 |
2.1300 |
| Industrial |
0.1050 |
0.1590 |
0.1680 |
0.1700 |
0.1770 |
0.1870 |
| Institutional |
0.0000 |
0.0000 |
0.0000 |
0.0000 |
0.0000 |
0.0000 |
| System Process |
0.2920 |
1.5000 |
1.5000 |
1.5000 |
1.5000 |
1.8000 |
| Unaccounted-for |
0.2037 |
0.0000 |
0.0000 |
0.0000 |
0.0000 |
0.0000 |
Demand v/s Percent of Supply
| |
2024 |
2030 |
2040 |
2050 |
2060 |
2070 |
| Surface Water Supply |
20.0000 |
20.0000 |
20.0000 |
20.0000 |
20.0000 |
20.0000 |
| Ground Water Supply |
0.0000 |
0.0000 |
0.0000 |
0.0000 |
0.0000 |
0.0000 |
| Purchases |
0.0000 |
0.0000 |
0.0000 |
0.0000 |
0.0000 |
0.0000 |
| Future Supplies |
0.0000 |
0.0000 |
0.0000 |
0.0000 |
0.0000 |
| Total Available Supply (MGD) |
20.0000 |
20.0000 |
20.0000 |
20.0000 |
20.0000 |
20.0000 |
| Service Area Demand |
2.6387 |
4.9590 |
5.0080 |
5.1000 |
5.4770 |
5.9370 |
| Sales |
7.5633 |
8.7500 |
8.7500 |
8.7500 |
8.7500 |
8.7500 |
| Future Sales |
0.0000 |
0.0000 |
0.0000 |
0.0000 |
0.0000 |
| Total Demand (MGD) |
10.2020 |
13.7090 |
13.7580 |
13.8500 |
14.2270 |
14.6870 |
| Demand as Percent of Supply |
51% |
69% |
69% |
69% |
71% |
73% |

The purpose of the above chart is to show a general indication of how the long-term per capita water demand changes over time. The per capita water demand may actually be different than indicated due to seasonal populations and the accuracy of data submitted. Water systems that have calculated long-term per capita water demand based on a methodology that produces different results may submit their information in the notes field.
Your long-term water demand is 57 gallons per capita per day. What demand management practices do you plan to implement to reduce the per capita water demand (i.e. conduct regular water audits, implement a plumbing retrofit program, employ practices such as rainwater harvesting or reclaimed water)? If these practices are covered elsewhere in your plan, indicate where the practices are discussed here.
Are there other demand management practices you will implement to reduce your future supply needs?
What supplies other than the ones listed in future supplies are being considered to meet your future supply needs?
How does the water system intend to implement the demand management and supply planning components above?
Additional Information
Has this system participated in regional water supply or water use planning? Yes, The City of Albemarle participates as a full member of the Yadkin-Pee Dee WMG. This group is made up of owners and stakeholders within the basin.These are public and private utilities that rely on the basin for water supply. The group has developed a basin wide model and analysis for planning the future needs and activities that are focused in the maintaining and sustainable water supply and quality in the basin for years to come.
What major water supply reports or studies were used for planning? Other LWSP's and WSRP's from other members of the group and basin wide model
Please describe any other needs or issues regarding your water supply sources, any water system deficiencies or needed improvements (storage, treatment, etc.) or your ability to meet present and future water needs. Include both quantity and quality considerations, as well as financial, technical, managerial, permitting, and compliance issues: The City of Albemarle is still engaged in talks about a possible expansion at JFNWTP that will address future needs of Concord/Kannapolis, Stanly County, P/NS and possibly other towns that have shown interest in their future needs, this will expand JFNWTP from 6.6mgd to 18mgd and a withdrawal of up to 30mgd to water systems and or DWR
The Division of Water Resources (DWR) provides the data contained within this
Local Water Supply Plan (LWSP) as a courtesy and service to our customers.
DWR staff does not field verify data. Neither DWR, nor any other party
involved in the preparation of this LWSP attests that the data is completely
free of errors and omissions. Furthermore, data users are cautioned that
LWSPs labeled PROVISIONAL have yet to be reviewed by DWR staff. Subsequent
review may result in significant revision. Questions regarding the accuracy
or limitations of usage of this data should be directed to the water system
and/or DWR.
|