|
The Division of Water Resources (DWR) provides the data contained within this
Local Water Supply Plan (LWSP) as a courtesy and service to our customers.
DWR staff does not field verify data. Neither DWR, nor any other party
involved in the preparation of this LWSP attests that the data is completely
free of errors and omissions. Furthermore, data users are cautioned that
LWSPs labeled PROVISIONAL have yet to be reviewed by DWR staff. Subsequent
review may result in significant revision. Questions regarding the accuracy
or limitations of usage of this data should be directed to the water system
and/or DWR.
1. System Information
Contact Information
Complete
| Water System Name: |
Bryson City |
|
PWSID: |
01-87-010 |
| Mailing Address: | P.O. Box 726
Bryson City, NC 28713 | Ownership: | Municipality |
| |
| Contact Person: | Sam Pattillo | Title: | Town Manager |
| Phone: | 828-488-3335 | Cell/Mobile: | 828-736-7448 |
| |
| Secondary Contact: | Russell Ball | | Phone: | 828-488-1004 |
| Mailing Address: | 1568 East Deep Creek Rd
Bryson City, NC 28713 | Cell/Mobile: | 828-736-1174 |
Distribution System
| Line Type |
Size Range (Inches) |
Estimated % of lines |
| Asbestos Cement |
6-8 |
6.00 % |
| Cast Iron |
4-10 |
18.00 % |
| Ductile Iron |
4-12 |
14.00 % |
| Galvanized Iron |
1-2 |
1.00 % |
| Other |
1-12 |
19.00 % |
| Polyvinyl Chloride |
1-10 |
42.00 % |
Programs
Regarding a high amount of unaccounted for water -- Leak detection is an on-going process, the Town has invested in a higher end listening device and leak correlator device. We are also working toward zone (master) meters for parts of the system that can monitored for leaks/accountability. Water Conservation
Our closest neighbor is Cherokee and it is 10 miles distance between systems. 2. Water Use Information
Service Area
| Sub-Basin(s) | % of Service Population |
|---|
| Tuskasegee River (07-2) | 100 % |
|
| County(s) | % of Service Population |
|---|
| Swain | 100 % |
|
Water Use by Type
| Type of Use |
Metered
Connections |
Metered
Average Use (MGD) |
Non-Metered
Connections |
Non-Metered
Estimated Use (MGD) |
| Residential |
1,283 |
0.1231 |
0 |
0.0000 |
| Commercial |
402 |
0.1653 |
0 |
0.0000 |
| Industrial |
0 |
0.0000 |
0 |
0.0000 |
| Institutional |
0 |
0.0000 |
0 |
0.0000 |
How much water was used for system processes (backwash, line cleaning, flushing, etc.)? 0.0230 MGD
3. Water Supply Sources
Monthly Withdrawals & Purchases
|
Average Daily
Use (MGD) |
Max Day
Use (MGD) |
|
Average Daily
Use (MGD) |
Max Day
Use (MGD) |
|
Average Daily
Use (MGD) |
Max Day
Use (MGD) |
| Jan |
0.5166 |
0.7020 |
May |
0.5136 |
0.5740 |
Sep |
0.5560 |
0.6510 |
| Feb |
0.4670 |
0.5200 |
Jun |
0.5292 |
0.6060 |
Oct |
0.5618 |
0.6810 |
| Mar |
0.4606 |
0.5260 |
Jul |
0.5748 |
0.6870 |
Nov |
0.5013 |
0.5610 |
| Apr |
0.4745 |
0.5690 |
Aug |
0.5755 |
0.7250 |
Dec |
0.4786 |
0.5520 |

Surface Water Sources
| Stream |
Reservoir |
Average Daily Withdrawal |
Maximum Day
Withdrawal (MGD) |
Available Raw
Water Supply |
Usable On-Stream
Raw Water Supply
Storage (MG) |
| MGD |
Days Used |
MGD |
* Qualifier |
| Deep Creek |
|
0.5174 |
366 |
0.7250 |
1.0000 |
F |
0.0000 |
* Qualifier: C=Contract Amount, SY20=20-year Safe Yield, SY50=50-year Safe Yield, F=20% of 7Q10 or other instream flow requirement, CUA=Capacity Use Area Permit
Surface Water Sources (continued)
| Stream |
Reservoir |
Drainage Area
(sq mi) |
Metered? |
Sub-Basin |
County |
Year
Offline |
Use
Type |
| Deep Creek |
|
43 |
Yes |
Tuskasegee River (07-2) |
Swain |
|
Regular |
Water Treatment Plants
| Plant Name |
Permitted Capacity
(MGD) |
Is Raw Water Metered? |
Is Finished Water Ouput Metered? |
Source |
| Deep Creek WTP |
1.0000 |
Yes |
Yes |
Deep Creek |
4. Wastewater Information
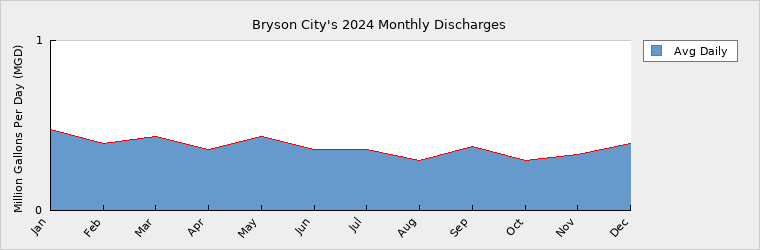
Monthly Discharges
|
Average Daily
Discharge (MGD) |
|
Average Daily
Discharge (MGD) |
|
Average Daily
Discharge (MGD) |
| Jan |
0.4748 |
May |
0.4347 |
Sep |
0.3751 |
| Feb |
0.3952 |
Jun |
0.3605 |
Oct |
0.2933 |
| Mar |
0.4337 |
Jul |
0.3582 |
Nov |
0.3286 |
| Apr |
0.3586 |
Aug |
0.2927 |
Dec |
0.3930 |
A sewer plant improvement project is in progress currently with construction to begin soon. FYI the discrepancy in Sewer service connections and Water service connections is due to Sewer only customers that are connected to the Collections system but do not have a Water service connection. If there was an additional line added to the LWSP for Sewer only services the totals would make sense. Wastewater Permits
| Permit Number |
Type |
Permitted Capacity
(MGD) |
Design Capacity
(MGD) |
Average Annual
Daily Discharge
(MGD) |
Maximum Day Discharge
(MGD) |
Receiving Stream |
Receiving Basin |
| NC0026557 |
WWTP |
0.6060 |
0.6060 |
0.3749 |
1.4979 |
Tuckasegee River |
Tuskasegee River (07-2) |
5. Planning
Projections
| |
2024 |
2030 |
2040 |
2050 |
2060 |
2070 |
| Year-Round Population |
4,395 |
4,482 |
4,571 |
4,662 |
4,755 |
4,850 |
| Seasonal Population |
0 |
0 |
0 |
0 |
0 |
0 |
| |
| Residential |
0.1231 |
0.1354 |
0.1486 |
0.1634 |
0.1797 |
0.1977 |
| Commercial |
0.1653 |
0.1818 |
0.1999 |
0.2198 |
0.2417 |
0.2658 |
| Industrial |
0.0000 |
0.0000 |
0.0000 |
0.0000 |
0.0000 |
0.0000 |
| Institutional |
0.0000 |
0.0000 |
0.0000 |
0.0000 |
0.0000 |
0.0000 |
| System Process |
0.0230 |
0.0242 |
0.0254 |
0.0266 |
0.0279 |
0.0293 |
| Unaccounted-for |
0.2060 |
0.2243 |
0.2457 |
0.2693 |
0.2952 |
0.3238 |
Improved billing and accountability is an ongoing process, a new meter system is scheduled for installation this upcoming budget year, and potentially improvements and changes to Billing systems as well. Demand v/s Percent of Supply
| |
2024 |
2030 |
2040 |
2050 |
2060 |
2070 |
| Surface Water Supply |
1.0000 |
1.0000 |
1.0000 |
1.0000 |
1.0000 |
1.0000 |
| Ground Water Supply |
0.0000 |
0.0000 |
0.0000 |
0.0000 |
0.0000 |
0.0000 |
| Purchases |
0.0000 |
0.0000 |
0.0000 |
0.0000 |
0.0000 |
0.0000 |
| Future Supplies |
0.0000 |
0.0000 |
0.0000 |
0.0000 |
0.0000 |
| Total Available Supply (MGD) |
1.0000 |
1.0000 |
1.0000 |
1.0000 |
1.0000 |
1.0000 |
| Service Area Demand |
0.5174 |
0.5657 |
0.6196 |
0.6791 |
0.7445 |
0.8166 |
| Sales |
0.0000 |
0.0000 |
0.0000 |
0.0000 |
0.0000 |
0.0000 |
| Future Sales |
0.0000 |
0.0000 |
0.0000 |
0.0000 |
0.0000 |
| Total Demand (MGD) |
0.5174 |
0.5657 |
0.6196 |
0.6791 |
0.7445 |
0.8166 |
| Demand as Percent of Supply |
52% |
57% |
62% |
68% |
74% |
82% |

The purpose of the above chart is to show a general indication of how the long-term per capita water demand changes over time. The per capita water demand may actually be different than indicated due to seasonal populations and the accuracy of data submitted. Water systems that have calculated long-term per capita water demand based on a methodology that produces different results may submit their information in the notes field.
Your long-term water demand is 28 gallons per capita per day. What demand management practices do you plan to implement to reduce the per capita water demand (i.e. conduct regular water audits, implement a plumbing retrofit program, employ practices such as rainwater harvesting or reclaimed water)? If these practices are covered elsewhere in your plan, indicate where the practices are discussed here.
"No Changes"
Are there other demand management practices you will implement to reduce your future supply needs? "No Changes"
What supplies other than the ones listed in future supplies are being considered to meet your future supply needs? "No Changes"
How does the water system intend to implement the demand management and supply planning components above? "No Changes"
Additional Information
Has this system participated in regional water supply or water use planning? No
What major water supply reports or studies were used for planning? LWSP from previous years, Water System Management Plan, WTP eMOR, WWTP Monthly reports, Billing Records, Daily Logs, Please note all data is supplied by the respective Dept. Head or ORC.
Please describe any other needs or issues regarding your water supply sources, any water system deficiencies or needed improvements (storage, treatment, etc.) or your ability to meet present and future water needs. Include both quantity and quality considerations, as well as financial, technical, managerial, permitting, and compliance issues: The Distribution system is looking to improve hydraulics with an additional River crossing and an additional 1MG of storage to improve fire protection on the South side of the system. Sewer Plant improvements are supposed to begin construction in the next few months as well.
The Division of Water Resources (DWR) provides the data contained within this
Local Water Supply Plan (LWSP) as a courtesy and service to our customers.
DWR staff does not field verify data. Neither DWR, nor any other party
involved in the preparation of this LWSP attests that the data is completely
free of errors and omissions. Furthermore, data users are cautioned that
LWSPs labeled PROVISIONAL have yet to be reviewed by DWR staff. Subsequent
review may result in significant revision. Questions regarding the accuracy
or limitations of usage of this data should be directed to the water system
and/or DWR.
|