|
The Division of Water Resources (DWR) provides the data contained within this
Local Water Supply Plan (LWSP) as a courtesy and service to our customers.
DWR staff does not field verify data. Neither DWR, nor any other party
involved in the preparation of this LWSP attests that the data is completely
free of errors and omissions. Furthermore, data users are cautioned that
LWSPs labeled PROVISIONAL have yet to be reviewed by DWR staff. Subsequent
review may result in significant revision. Questions regarding the accuracy
or limitations of usage of this data should be directed to the water system
and/or DWR.
1. System Information
Contact Information
Complete
| Water System Name: |
Connestee Falls |
|
PWSID: |
01-88-104 |
| Mailing Address: | P.O. Box 240908
Charlotte, NC 28224 | Ownership: | Business |
| |
| Contact Person: | Harshna Patel | Title: | Water Quality Coordinator |
| Phone: | 704-608-4974 | Cell/Mobile: | -- |
Distribution System
| Line Type |
Size Range (Inches) |
Estimated % of lines |
| Ductile Iron |
6-8 |
1.00 % |
| Polyvinyl Chloride |
2-8 |
99.00 % |
Miles revised from previously reported. Programs
Listening to valves to isolate leaks conducted often through out the system. In 2024 several leaks were found and repaired.
With the AMR meters installed, possible leaks can be detected and addresses early before they become serious, and costly. The company's water accountability program tracks pumpage, known water loss (from system processes, identified leaks, etc.) and water sold to determine monthly unaccounted for water loss. Water Conservation
Sherwood Forest, a groundwater system owned and operated by Carolina Water Service of NC, is nearby but does not have sufficient production to supply Connestee Falls. The Town of Brevard is the closest municipality (approximately 7 miles away) but the cost of running water lines to Connestee Falls prohibits them from supplying the system. 2. Water Use Information
Service Area
| Sub-Basin(s) | % of Service Population |
|---|
| French Broad River (05-2) | 100 % |
|
| County(s) | % of Service Population |
|---|
| Transylvania | 100 % |
|
Population is determined by multiplying the number of water connections (less irrigation) by 2.20. 2019-2023 U.S census data lists as the persons per household for Transylvania County, NC. Water Use by Type
| Type of Use |
Metered
Connections |
Metered
Average Use (MGD) |
Non-Metered
Connections |
Non-Metered
Estimated Use (MGD) |
| Residential |
1,462 |
0.1025 |
0 |
0.0000 |
| Commercial |
19 |
0.0043 |
0 |
0.0000 |
| Industrial |
0 |
0.0000 |
0 |
0.0000 |
| Institutional |
0 |
0.0000 |
0 |
0.0000 |
How much water was used for system processes (backwash, line cleaning, flushing, etc.)? 0.0177 MGD
3. Water Supply Sources
Monthly Withdrawals & Purchases
|
Average Daily
Use (MGD) |
Max Day
Use (MGD) |
|
Average Daily
Use (MGD) |
Max Day
Use (MGD) |
|
Average Daily
Use (MGD) |
Max Day
Use (MGD) |
| Jan |
0.2369 |
0.3473 |
May |
0.2097 |
0.2839 |
Sep |
0.2331 |
0.3167 |
| Feb |
0.1958 |
0.2276 |
Jun |
0.2455 |
0.3295 |
Oct |
0.2525 |
0.4701 |
| Mar |
0.2105 |
0.3406 |
Jul |
0.2608 |
0.3611 |
Nov |
0.2446 |
0.5202 |
| Apr |
0.1976 |
0.3076 |
Aug |
0.2585 |
0.4036 |
Dec |
0.2535 |
0.3567 |

Ground Water Sources
| Name or Number |
Average Daily Withdrawal (MGD) |
Max Day Withdrawal (MGD) |
12-Hour Supply
(MGD) |
CUA Reduction |
Year Offline |
Use Type |
| MGD |
Days Used |
| Well #1 |
0.0000 |
0 |
0 |
0.0470 |
|
|
Regular |
| Well #10 |
0.0120 |
360 |
0.0218 |
0.0190 |
|
|
Regular |
| Well #11 |
0.0130 |
223 |
0.0215 |
0.0220 |
|
|
Regular |
| Well #2 |
0.0569 |
298 |
0.196 |
0.0840 |
|
|
Regular |
| Well #4 |
0.0546 |
343 |
0.1745 |
0.0950 |
|
|
Regular |
| Well #5 |
0.0149 |
357 |
0.0506 |
0.0300 |
|
|
Regular |
| Well #7 |
0.0307 |
358 |
0.0678 |
0.0490 |
|
|
Regular |
| Well #8 |
0.0476 |
261 |
0.1576 |
0.0940 |
|
|
Regular |
| Well #9 |
0.0622 |
222 |
0.1875 |
0.0900 |
|
|
Regular |
Ground Water Sources (continued)
| Name or Number |
Well Depth (Feet) |
Casing Depth
(Feet) |
Screen Depth (Feet) |
Well Diameter (Inches) |
Pump Intake Depth (Feet) |
Metered? |
| Top |
Bottom |
| Well #1 |
760 |
50 |
|
|
6 |
635 |
Yes |
| Well #10 |
770 |
50 |
|
|
8 |
420 |
Yes |
| Well #11 |
1005 |
54 |
|
|
8 |
538 |
Yes |
| Well #2 |
215 |
84 |
|
|
8 |
168 |
Yes |
| Well #4 |
185 |
55 |
|
|
8 |
147 |
Yes |
| Well #5 |
220 |
30 |
|
|
8 |
189 |
Yes |
| Well #7 |
860 |
52 |
|
|
8 |
798 |
Yes |
| Well #8 |
840 |
52 |
|
|
8 |
798 |
Yes |
| Well #9 |
840 |
52 |
|
|
8 |
798 |
Yes |
4. Wastewater Information
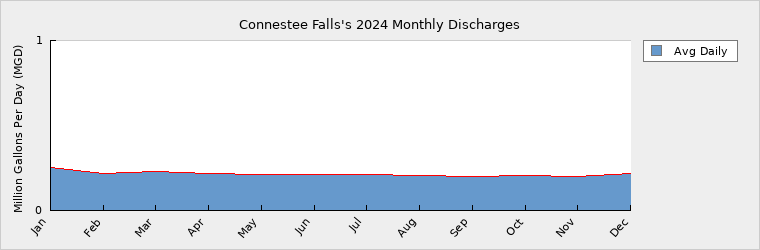
Monthly Discharges
|
Average Daily
Discharge (MGD) |
|
Average Daily
Discharge (MGD) |
|
Average Daily
Discharge (MGD) |
| Jan |
0.2507 |
May |
0.2133 |
Sep |
0.1995 |
| Feb |
0.2186 |
Jun |
0.2097 |
Oct |
0.2039 |
| Mar |
0.2315 |
Jul |
0.2136 |
Nov |
0.1977 |
| Apr |
0.2179 |
Aug |
0.2058 |
Dec |
0.2163 |
The system has 1054 water/sewer connections and 6 sewer only connections. 427 water only connections, one is for irrigation.
Wastewater Treatment Plant #1: The plant has an allowed expansion to 0.46 mgd.
Wastewater Treatment Plant #2: The plant is permitted at 0.020 mgd, with an allowed expansion to 0.066 mgd. Expansion within the next 10 years depends upon future development in the system, and the resulting increased demand.
Wastewater Permits
| Permit Number |
Type |
Permitted Capacity
(MGD) |
Design Capacity
(MGD) |
Average Annual
Daily Discharge
(MGD) |
Maximum Day Discharge
(MGD) |
Receiving Stream |
Receiving Basin |
| NC0024295 |
WWTP |
0.4600 |
0.3600 |
0.2064 |
0.7800 |
French Broad River |
French Broad River (05-2) |
| NC0088943 |
WWTP |
0.0660 |
0.0200 |
0.0085 |
0.0480 |
Lower Creek |
French Broad River (05-2) |
5. Planning
Projections
| |
2024 |
2030 |
2040 |
2050 |
2060 |
2070 |
| Year-Round Population |
3,256 |
3,392 |
3,688 |
3,938 |
4,188 |
4,438 |
| Seasonal Population |
0 |
0 |
0 |
0 |
0 |
0 |
| |
| Residential |
0.1025 |
0.1129 |
0.1211 |
0.1293 |
0.1375 |
0.1457 |
| Commercial |
0.0043 |
0.0046 |
0.0049 |
0.0052 |
0.0056 |
0.0059 |
| Industrial |
0.0000 |
0.0000 |
0.0000 |
0.0000 |
0.0000 |
0.0000 |
| Institutional |
0.0000 |
0.0000 |
0.0000 |
0.0000 |
0.0000 |
0.0000 |
| System Process |
0.0177 |
0.0177 |
0.0177 |
0.0177 |
0.0177 |
0.0177 |
| Unaccounted-for |
0.1090 |
0.1184 |
0.1258 |
0.1333 |
0.1408 |
0.1482 |
Demand v/s Percent of Supply
| |
2024 |
2030 |
2040 |
2050 |
2060 |
2070 |
| Surface Water Supply |
0.0000 |
0.0000 |
0.0000 |
0.0000 |
0.0000 |
0.0000 |
| Ground Water Supply |
0.5300 |
0.5300 |
0.5300 |
0.5300 |
0.5300 |
0.5300 |
| Purchases |
0.0000 |
0.0000 |
0.0000 |
0.0000 |
0.0000 |
0.0000 |
| Future Supplies |
0.0000 |
0.0000 |
0.0000 |
0.0000 |
0.0000 |
| Total Available Supply (MGD) |
0.5300 |
0.5300 |
0.5300 |
0.5300 |
0.5300 |
0.5300 |
| Service Area Demand |
0.2335 |
0.2536 |
0.2695 |
0.2855 |
0.3016 |
0.3175 |
| Sales |
0.0000 |
0.0000 |
0.0000 |
0.0000 |
0.0000 |
0.0000 |
| Future Sales |
0.0000 |
0.0000 |
0.0000 |
0.0000 |
0.0000 |
| Total Demand (MGD) |
0.2335 |
0.2536 |
0.2695 |
0.2855 |
0.3016 |
0.3175 |
| Demand as Percent of Supply |
44% |
48% |
51% |
54% |
57% |
60% |

The purpose of the above chart is to show a general indication of how the long-term per capita water demand changes over time. The per capita water demand may actually be different than indicated due to seasonal populations and the accuracy of data submitted. Water systems that have calculated long-term per capita water demand based on a methodology that produces different results may submit their information in the notes field.
Your long-term water demand is 31 gallons per capita per day. What demand management practices do you plan to implement to reduce the per capita water demand (i.e. conduct regular water audits, implement a plumbing retrofit program, employ practices such as rainwater harvesting or reclaimed water)? If these practices are covered elsewhere in your plan, indicate where the practices are discussed here.
no changes
Are there other demand management practices you will implement to reduce your future supply needs? Continue to implement water loss detection services within the distribution system. Company has allocated budgetary resources for professional services related to water loss detection within the distribution system.
What supplies other than the ones listed in future supplies are being considered to meet your future supply needs? Continue periodic review of the water demand at Connestee Falls to identify in conjunction with system growth and/ or demand changes. These actions will help to ensure timely planning and execution of system expansions/improvements as needed.
How does the water system intend to implement the demand management and supply planning components above? We would pursue engineering design and state approval for any changes to our water supply.
Additional Information
Has this system participated in regional water supply or water use planning? No
What major water supply reports or studies were used for planning?
Please describe any other needs or issues regarding your water supply sources, any water system deficiencies or needed improvements (storage, treatment, etc.) or your ability to meet present and future water needs. Include both quantity and quality considerations, as well as financial, technical, managerial, permitting, and compliance issues:
The Division of Water Resources (DWR) provides the data contained within this
Local Water Supply Plan (LWSP) as a courtesy and service to our customers.
DWR staff does not field verify data. Neither DWR, nor any other party
involved in the preparation of this LWSP attests that the data is completely
free of errors and omissions. Furthermore, data users are cautioned that
LWSPs labeled PROVISIONAL have yet to be reviewed by DWR staff. Subsequent
review may result in significant revision. Questions regarding the accuracy
or limitations of usage of this data should be directed to the water system
and/or DWR.
|