|
The Division of Water Resources (DWR) provides the data contained within this
Local Water Supply Plan (LWSP) as a courtesy and service to our customers.
DWR staff does not field verify data. Neither DWR, nor any other party
involved in the preparation of this LWSP attests that the data is completely
free of errors and omissions. Furthermore, data users are cautioned that
LWSPs labeled PROVISIONAL have yet to be reviewed by DWR staff. Subsequent
review may result in significant revision. Questions regarding the accuracy
or limitations of usage of this data should be directed to the water system
and/or DWR.
1. System Information
Contact Information
Complete
| Water System Name: |
Boone |
|
PWSID: |
01-95-010 |
| Mailing Address: | 321 E. King Street
Boone, NC 28607 | Ownership: | Municipality |
| |
| Contact Person: | Joshua Eller | Title: | Deputy Public Works Director |
| Phone: | 828-268-6250 | Cell/Mobile: | -- |
| |
| Secondary Contact: | Mike Trivette | | Phone: | 828-268-6250 |
| Mailing Address: | 321 E. King Street
Boone, NC 28607 | Cell/Mobile: | -- |
Distribution System
| Line Type |
Size Range (Inches) |
Estimated % of lines |
| Asbestos Cement |
4-12 |
15.00 % |
| Cast Iron |
6-8 |
4.00 % |
| Ductile Iron |
4-24 |
52.00 % |
| Polyvinyl Chloride |
4-12 |
29.00 % |
Inadequate system pressure resulted from the nearly system wide water loss experienced during Hurricane Helene. This event affected portions of our water system for several days. Programs
Water Conservation
2. Water Use Information
Service Area
| Sub-Basin(s) | % of Service Population |
|---|
| New River (11-1) | 100 % |
|
| County(s) | % of Service Population |
|---|
| Watauga | 100 % |
|
Water Use by Type
| Type of Use |
Metered
Connections |
Metered
Average Use (MGD) |
Non-Metered
Connections |
Non-Metered
Estimated Use (MGD) |
| Residential |
5,397 |
0.5840 |
0 |
0.0000 |
| Commercial |
771 |
0.5470 |
0 |
0.0000 |
| Industrial |
12 |
0.0042 |
0 |
0.0000 |
| Institutional |
40 |
0.0090 |
0 |
0.0000 |
How much water was used for system processes (backwash, line cleaning, flushing, etc.)? 0.0025 MGD
Water Sales
| Purchaser |
PWSID |
Average
Daily Sold
(MGD) |
Days
Used |
Contract |
Required to
comply with water
use restrictions? |
Pipe Size(s)
(Inches) |
Use
Type |
| MGD |
Expiration |
Recurring |
| Appalachain State University |
01-95-101 |
0.0000 |
0 |
0.0000 |
|
No |
Yes |
12 |
Emergency |
| Blowing Rock |
01-95-020 |
0.0000 |
0 |
0.0000 |
|
No |
Yes |
12 |
Emergency |
3. Water Supply Sources
Monthly Withdrawals & Purchases
|
Average Daily
Use (MGD) |
Max Day
Use (MGD) |
|
Average Daily
Use (MGD) |
Max Day
Use (MGD) |
|
Average Daily
Use (MGD) |
Max Day
Use (MGD) |
| Jan |
2.1200 |
3.0800 |
May |
1.7620 |
2.2510 |
Sep |
1.9800 |
3.9610 |
| Feb |
2.0560 |
2.4140 |
Jun |
1.7010 |
1.8900 |
Oct |
2.0830 |
3.8540 |
| Mar |
1.8290 |
2.1440 |
Jul |
1.7180 |
2.0260 |
Nov |
1.7360 |
1.9620 |
| Apr |
1.8760 |
2.2050 |
Aug |
1.7480 |
2.1500 |
Dec |
1.6810 |
2.1390 |

Surface Water Sources
| Stream |
Reservoir |
Average Daily Withdrawal |
Maximum Day
Withdrawal (MGD) |
Available Raw
Water Supply |
Usable On-Stream
Raw Water Supply
Storage (MG) |
| MGD |
Days Used |
MGD |
* Qualifier |
| New River |
Greg Young Intake |
1.8140 |
357 |
3.9610 |
4.0000 |
F |
0.0000 |
| South Fork |
|
1.0330 |
29 |
2.1180 |
3.0000 |
F |
0.0000 |
| Winklers Creek |
|
0.8070 |
2 |
0.8160 |
0.2400 |
F |
60.0000 |
* Qualifier: C=Contract Amount, SY20=20-year Safe Yield, SY50=50-year Safe Yield, F=20% of 7Q10 or other instream flow requirement, CUA=Capacity Use Area Permit
Surface Water Sources (continued)
| Stream |
Reservoir |
Drainage Area
(sq mi) |
Metered? |
Sub-Basin |
County |
Year
Offline |
Use
Type |
| New River |
Greg Young Intake |
102 |
Yes |
New River (11-1) |
Watauga |
|
Regular |
| South Fork |
|
18 |
Yes |
New River (11-1) |
Watauga |
|
Regular |
| Winklers Creek |
|
5 |
Yes |
New River (11-1) |
Watauga |
|
Emergency |
Water Purchases From Other Systems
| Seller |
PWSID |
Average
Daily Purchased
(MGD) |
Days
Used |
Contract |
Required to
comply with water
use restrictions? |
Pipe Size(s)
(Inches) |
Use
Type |
| MGD |
Expiration |
Recurring |
| Appalachian State University |
01-95-101 |
1.5000 |
2 |
0.0000 |
|
No |
Yes |
12 |
Emergency |
| Blowing Rock |
01-95-020 |
0.0000 |
0 |
0.0000 |
|
No |
Yes |
12 |
Emergency |
Water Treatment Plants
| Plant Name |
Permitted Capacity
(MGD) |
Is Raw Water Metered? |
Is Finished Water Ouput Metered? |
Source |
| Boone Water Plant |
4.5000 |
Yes |
Yes |
Greg Young Intake, South Fork & Winklers Creek |
4. Wastewater Information
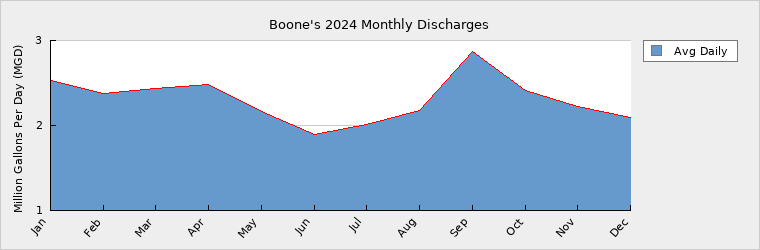
Monthly Discharges
|
Average Daily
Discharge (MGD) |
|
Average Daily
Discharge (MGD) |
|
Average Daily
Discharge (MGD) |
| Jan |
2.5300 |
May |
2.1700 |
Sep |
2.8700 |
| Feb |
2.3800 |
Jun |
1.8900 |
Oct |
2.4100 |
| Mar |
2.4300 |
Jul |
2.0100 |
Nov |
2.2200 |
| Apr |
2.4800 |
Aug |
2.1800 |
Dec |
2.0900 |
Wastewater Permits
| Permit Number |
Type |
Permitted Capacity
(MGD) |
Design Capacity
(MGD) |
Average Annual
Daily Discharge
(MGD) |
Maximum Day Discharge
(MGD) |
Receiving Stream |
Receiving Basin |
| NC0020621 |
WWTP |
4.8200 |
4.8200 |
2.3000 |
10.8000 |
South Fork New River |
New River (11-1) |
Wastewater Interconnections
| Water System |
PWSID |
Type |
Average Daily Amount |
Contract
Maximum (MGD) |
| MGD |
Days Used |
| Appalachian State University |
01-95-101 |
Receiving |
0.1950 |
365 |
|
5. Planning
Projections
| |
2024 |
2030 |
2040 |
2050 |
2060 |
2070 |
| Year-Round Population |
20,017 |
24,136 |
28,963 |
34,755 |
41,706 |
50,047 |
| Seasonal Population |
0 |
0 |
0 |
0 |
0 |
0 |
| |
| Residential |
0.5840 |
0.6758 |
0.8110 |
0.9731 |
1.1678 |
1.4013 |
| Commercial |
0.5470 |
0.5503 |
0.5558 |
0.5614 |
0.5670 |
0.5727 |
| Industrial |
0.0042 |
0.0006 |
0.0006 |
0.0006 |
0.0006 |
0.0006 |
| Institutional |
0.0090 |
0.0779 |
0.0861 |
0.0951 |
0.1050 |
0.1160 |
| System Process |
0.0025 |
0.0268 |
0.0296 |
0.0327 |
0.0361 |
0.0399 |
| Unaccounted-for |
0.7171 |
0.3762 |
0.4197 |
0.4691 |
0.5312 |
0.6014 |
The Projections Evaluation Tool was used to project demand estimates.
There was a very large increase (600%) in industrial demand from 2023 (0.0006 MGD) to 2024 (0.0042 MGD). The 2023 demand was used to start the projections for industrial demand.
There was a large decrease (89%) in institutional demand from 2023 (0.082 MGD) to 2024 (0.009 MGD). Based on the analysis, a reasonable 2024 demand would have been around 0.0734 MGD which is the number used to begin the projections for institutional demand.
There was a large decrease (90%) in process demand from 2023 (0.0250 MGD) to 2024 (0.0025 MGD). The 2023 demand was used to start the projections for process demand. Demand v/s Percent of Supply
| |
2024 |
2030 |
2040 |
2050 |
2060 |
2070 |
| Surface Water Supply |
7.0000 |
7.0000 |
7.0000 |
7.0000 |
7.0000 |
7.0000 |
| Ground Water Supply |
0.0000 |
0.0000 |
0.0000 |
0.0000 |
0.0000 |
0.0000 |
| Purchases |
0.0000 |
0.0000 |
0.0000 |
0.0000 |
0.0000 |
0.0000 |
| Future Supplies |
0.0000 |
0.0000 |
0.0000 |
0.0000 |
0.0000 |
| Total Available Supply (MGD) |
7.0000 |
7.0000 |
7.0000 |
7.0000 |
7.0000 |
7.0000 |
| Service Area Demand |
1.8638 |
1.7076 |
1.9028 |
2.1320 |
2.4077 |
2.7319 |
| Sales |
0.0000 |
0.0000 |
0.0000 |
0.0000 |
0.0000 |
0.0000 |
| Future Sales |
0.0000 |
0.0000 |
0.0000 |
0.0000 |
0.0000 |
| Total Demand (MGD) |
1.8638 |
1.7076 |
1.9028 |
2.1320 |
2.4077 |
2.7319 |
| Demand as Percent of Supply |
27% |
24% |
27% |
30% |
34% |
39% |

The purpose of the above chart is to show a general indication of how the long-term per capita water demand changes over time. The per capita water demand may actually be different than indicated due to seasonal populations and the accuracy of data submitted. Water systems that have calculated long-term per capita water demand based on a methodology that produces different results may submit their information in the notes field.
Your long-term water demand is 29 gallons per capita per day. What demand management practices do you plan to implement to reduce the per capita water demand (i.e. conduct regular water audits, implement a plumbing retrofit program, employ practices such as rainwater harvesting or reclaimed water)? If these practices are covered elsewhere in your plan, indicate where the practices are discussed here.
No Change
Are there other demand management practices you will implement to reduce your future supply needs?
What supplies other than the ones listed in future supplies are being considered to meet your future supply needs?
How does the water system intend to implement the demand management and supply planning components above?
Additional Information
Has this system participated in regional water supply or water use planning? No
What major water supply reports or studies were used for planning?
Please describe any other needs or issues regarding your water supply sources, any water system deficiencies or needed improvements (storage, treatment, etc.) or your ability to meet present and future water needs. Include both quantity and quality considerations, as well as financial, technical, managerial, permitting, and compliance issues: We replaced the Venturi meter at our Water Treatment Plant in 2024. The calibration has been incorrect through our SCADA system, producing an inaccurate number of unaccounted water. Staff are working with an Engineer to correct this issue and should have more accurate data for the 2025 LWSP update. It also appears that we may have an issue with our meter billing software producing inaccurate data that we will investigate further.
The Division of Water Resources (DWR) provides the data contained within this
Local Water Supply Plan (LWSP) as a courtesy and service to our customers.
DWR staff does not field verify data. Neither DWR, nor any other party
involved in the preparation of this LWSP attests that the data is completely
free of errors and omissions. Furthermore, data users are cautioned that
LWSPs labeled PROVISIONAL have yet to be reviewed by DWR staff. Subsequent
review may result in significant revision. Questions regarding the accuracy
or limitations of usage of this data should be directed to the water system
and/or DWR.
|