|
The Division of Water Resources (DWR) provides the data contained within this
Local Water Supply Plan (LWSP) as a courtesy and service to our customers.
DWR staff does not field verify data. Neither DWR, nor any other party
involved in the preparation of this LWSP attests that the data is completely
free of errors and omissions. Furthermore, data users are cautioned that
LWSPs labeled PROVISIONAL have yet to be reviewed by DWR staff. Subsequent
review may result in significant revision. Questions regarding the accuracy
or limitations of usage of this data should be directed to the water system
and/or DWR.
1. System Information
Contact Information
Provisional
| Water System Name: |
Beech Mountain |
|
PWSID: |
01-95-104 |
| Mailing Address: | 403 Beech Mountain Parkway
Beech Mountain, NC 28604 | Ownership: | Municipality |
| |
| Contact Person: | Daniel Davis | Title: | Director of Utilities |
| Phone: | 828-387-9282 | Cell/Mobile: | -- |
Distribution System
| Line Type |
Size Range (Inches) |
Estimated % of lines |
| Ductile Iron |
4-8 |
15.00 % |
| Galvanized Iron |
2-12 |
84.00 % |
| Polyvinyl Chloride |
6 |
1.00 % |
In 2021, we completed the 2020/2021 FY project totaling 17,000 feet of water main and associated service connections. We have further scheduled the next project including an estimated 22,700 feet of water main and associated service connections for the 2022/2023 FY. This project is part of the continuing water main upgrades plans to replace large areas of galvanized piping installed in the late 1960's by the original developer before the township was incorporated and is on schedule form completion in 2025. We continue a 10 year initiative to begin replacing as a target number 150 service connections annually, removing3/4"galvanized piping and replacing with a polyethylene(PexA) product as further effort to reduce loss throughout the system. In 2022, we replaced 40 services at an estimated 1200 feet of service connections as well. We also have a planned program to replace an additional 400 3/4" galvanized service connections as a special service line replacement project over the next 2 years which is progressing. Programs
We use digital meters which allow for weekly readings of the service meters to monitor meter usage, totals, and leakage as well as leak listening devices and correlators to identify main line leakage in suspect areas. We also have a monthly, quarterly, and annual hydrant flushing program that is utilized to maintain pleasing water to our citizens. We work each year with the NC Rural Water Association on a system wide leak detection effort. Water Conservation
2. Water Use Information
Service Area
| Sub-Basin(s) | % of Service Population |
|---|
| Watauga River (16-1) | 100 % |
|
| County(s) | % of Service Population |
|---|
| Watauga | 85 % |
| Avery | 15 % |
|
Nearly all the population at Beech Mountain is transient. Population data sources: current year-round population from Office of State Management and Budget(OSMB), current seasonal population from Town of Beech Mountain 2020-35 Comprehensive Plan chapter 4, page 13 (and applying 2.45% annual seasonal growth rate as indicated in the Plan). Water Use by Type
| Type of Use |
Metered
Connections |
Metered
Average Use (MGD) |
Non-Metered
Connections |
Non-Metered
Estimated Use (MGD) |
| Residential |
2,187 |
0.1260 |
0 |
0.0000 |
| Commercial |
64 |
0.0280 |
0 |
0.0000 |
| Industrial |
0 |
0.0000 |
0 |
0.0000 |
| Institutional |
0 |
0.0000 |
0 |
0.0000 |
How much water was used for system processes (backwash, line cleaning, flushing, etc.)? 0.0300 MGD
3. Water Supply Sources
Monthly Withdrawals & Purchases
|
Average Daily
Use (MGD) |
Max Day
Use (MGD) |
|
Average Daily
Use (MGD) |
Max Day
Use (MGD) |
|
Average Daily
Use (MGD) |
Max Day
Use (MGD) |
| Jan |
0.7710 |
1.0610 |
May |
0.3820 |
0.7630 |
Sep |
0.5080 |
0.6960 |
| Feb |
0.6910 |
1.0310 |
Jun |
0.4060 |
0.5120 |
Oct |
0.4570 |
0.7730 |
| Mar |
0.4510 |
0.6180 |
Jul |
0.4680 |
0.5920 |
Nov |
0.4360 |
0.6400 |
| Apr |
0.3380 |
0.2550 |
Aug |
0.5250 |
1.0140 |
Dec |
0.5330 |
0.7230 |

Ground Water Sources
| Name or Number |
Average Daily Withdrawal (MGD) |
Max Day Withdrawal (MGD) |
12-Hour Supply
(MGD) |
CUA Reduction |
Year Offline |
Use Type |
| MGD |
Days Used |
| Pinnacle Ridge Well |
0.0320 |
275 |
0.071 |
0.1040 |
CUA0 |
|
Regular |
Ground Water Sources (continued)
| Name or Number |
Well Depth (Feet) |
Casing Depth
(Feet) |
Screen Depth (Feet) |
Well Diameter (Inches) |
Pump Intake Depth (Feet) |
Metered? |
| Top |
Bottom |
| Pinnacle Ridge Well |
680 |
100 |
100 |
100 |
6 |
540 |
Yes |
Surface Water Sources
| Stream |
Reservoir |
Average Daily Withdrawal |
Maximum Day
Withdrawal (MGD) |
Available Raw
Water Supply |
Usable On-Stream
Raw Water Supply
Storage (MG) |
| MGD |
Days Used |
MGD |
* Qualifier |
| Buckeye Creek |
Buckeye Lake |
0.4970 |
365 |
1.0610 |
0.2400 |
SY50 |
30.0000 |
| Pond Creek |
Lake Coffey |
0.0000 |
0 |
0.0000 |
0.0300 |
F |
7.0000 |
* Qualifier: C=Contract Amount, SY20=20-year Safe Yield, SY50=50-year Safe Yield, F=20% of 7Q10 or other instream flow requirement, CUA=Capacity Use Area Permit
Surface Water Sources (continued)
| Stream |
Reservoir |
Drainage Area
(sq mi) |
Metered? |
Sub-Basin |
County |
Year
Offline |
Use
Type |
| Buckeye Creek |
Buckeye Lake |
3 |
Yes |
Watauga River (16-1) |
Watauga |
|
Regular |
| Pond Creek |
Lake Coffey |
1 |
No |
Watauga River (16-1) |
Watauga |
|
Emergency |
Buckeye Lake was constructed in 1985/1986 and was at operational water levels by 1987. The 20- year safe yield for Buckeye Lake was reported in the 1989DWR Water Supply System Report to be 2.0 mgd. The basis for this estimate is unknown. Since construction, the actual available safe yield of Buckeye Lake has been found to be significantly less than the originally reported 2.0 mgd estimation. According to the February 2014 Buckeye Lake Yield Analysis document by West Consultants, the safe yield of Buckeye Lake is approximately 0.3 mgd; however, this value is only valid under specific qualifying conditions. The most important condition is that this value does not include the existing minimum release requirements set forth in the United States Army Corps of Engineers
(USACE)Permit (i.e., Section 404- Clean Water Act) for construction of the Buckeye Lake dam. The
permit, issued November 1984, requires a minimum flow release from the dam of 2.8 cfs (1.8 mgd) through October, November and December, intended to provide needed flows during the native brook trout spawning period. The remainder of the year (i.e., January through September), the required minimum release is 1.5 cfs (0.97 mgd), intended to maintain the existing water quality of Buckeye Creek. The 2014 Yield Analysis report makes it clear that when including the required minimum releases, as dictated by the USACE permit, the safe yield should be considered zero under low flow conditions or in times of drought. It should also be noted that similar to the Buckeye Creek flow estimations, the safe yield calculations used USGS gage data from the Watauga and Elk Rivers. In light of recent DWR modelling difficulties regarding Buckeye Creek, use of these values should be considered questionable, even though this methodology is the only available means to make such estimations. The 1984 minimum release requirements used in the 2014 Buckeye Lake Yield Analysis document by West Consultants were not achievable during droughts such as the town
experienced in 2010. Therefore, the town requested a modification to the dam permit issued by US Army Corps of Engineers.
On November 20th, 2019 The Town of Beech Mountain received approval of Individual 401 Water Quality Certification (Certification #1756)(USACE Action ID. No.SAW-2018-02144) which replaces the certification based on October 8th, 1984. Based on this certification protocol, West Consultants has calculated the current estimated yield of Buckeye Lake to be 0.240 MGD. The minimums approved are still significant (up to 1.64 MGD) but are more achievable, however, yields shown are theoretical based on assumption that the Buckeye Lake watershed characteristics mimic the Watauga River watershed. Actual yields may be lower than shown.
In 2019 Beech Mountain moved forward to aid this calculation process by partnering with the U.S. Department of the Interior; U.S. Geological Survey to install and maintain stream gage stations upstream and downstream of the Buckeye Lake Reservoir. This data will be used to provide accurate stream flow calculations into the future aiding the ability to accurately meet USACE permit requirements. This data will be used to build a historical database for more accurate stream flow calculations.
In 2021, Beech Mountain began engineering design on expansion of the Lake Coffey water supply source. Recent discussions with NCDEQ, NC Wildlife, and US Army Corps. of Engineers on feasibility of the project have been favorable and expectations are now that the project will be acceptable as a solution for the town from all groups involved. Beech Mountain is proceeding with the constructing of the Lake Coffey expansion to mitigate threats to our system from natural disaster, especially drought situations, but also for common occurrence of earthquakes, electrical storms, and flood surge events which consistently damage our system. This project will directly improve our resiliency in the public water system by not only providing additional source water for treatment, but also to provide redundancy to our sources mitigating the single source situation we are currently in. Lake Coffey is also fed by a separate source stream, Pond Creek, than our existing Buckeye Lake source on Buckeye Creek. This allows for resilience in case of any contamination of either stream. Water Treatment Plants
| Plant Name |
Permitted Capacity
(MGD) |
Is Raw Water Metered? |
Is Finished Water Ouput Metered? |
Source |
| Buckeye Treatment Plant |
1.0000 |
Yes |
Yes |
Buckeye Lake |
4. Wastewater Information
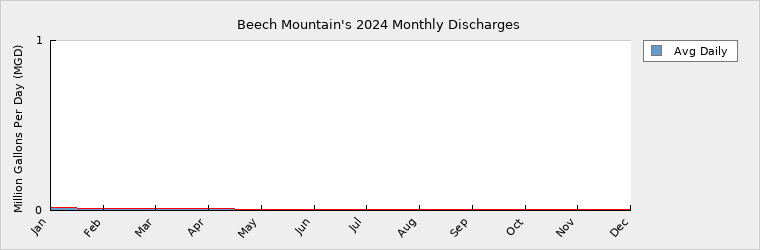
Monthly Discharges
|
Average Daily
Discharge (MGD) |
|
Average Daily
Discharge (MGD) |
|
Average Daily
Discharge (MGD) |
| Jan |
0.4935 |
May |
0.2710 |
Sep |
0.2040 |
| Feb |
0.4206 |
Jun |
0.1500 |
Oct |
0.1408 |
| Mar |
0.3297 |
Jul |
0.1942 |
Nov |
0.1379 |
| Apr |
0.3071 |
Aug |
0.1634 |
Dec |
0.2792 |
Wastewater Permits
| Permit Number |
Type |
Permitted Capacity
(MGD) |
Design Capacity
(MGD) |
Average Annual
Daily Discharge
(MGD) |
Maximum Day Discharge
(MGD) |
Receiving Stream |
Receiving Basin |
| NC0022730 |
WWTP |
0.0800 |
0.0800 |
0.0472 |
0.3210 |
Grassy Gap Creek |
Watauga River (16-1) |
| NC0069761 |
WWTP |
0.4000 |
0.4000 |
0.1873 |
1.1000 |
Pond Creek |
Watauga River (16-1) |
| NC0088099 |
WTP |
0.0500 |
0.0500 |
0.0232 |
0.1670 |
Buckeye Creek |
Watauga River (16-1) |
5. Planning
Projections
| |
2024 |
2030 |
2040 |
2050 |
2060 |
2070 |
| Year-Round Population |
712 |
823 |
1,049 |
1,336 |
1,702 |
2,168 |
| Seasonal Population |
5,844 |
6,757 |
8,608 |
10,965 |
12,500 |
12,556 |
| |
| Residential |
0.1260 |
0.1457 |
0.1856 |
0.2364 |
0.2695 |
0.2707 |
| Commercial |
0.0280 |
0.0324 |
0.0412 |
0.0525 |
0.0599 |
0.0602 |
| Industrial |
0.0000 |
0.0000 |
0.0000 |
0.0000 |
0.0000 |
0.0000 |
| Institutional |
0.0000 |
0.0000 |
0.0000 |
0.0000 |
0.0000 |
0.0000 |
| System Process |
0.0300 |
0.0300 |
0.0300 |
0.0300 |
0.0300 |
0.0300 |
| Unaccounted-for |
0.3357 |
0.4030 |
0.4980 |
0.5260 |
0.5260 |
0.5260 |
Population data sources: current year-round population from Office of State Management and Budget (OSMB), current seasonal population from Town of Beech Mountain 2020-35 Comprehensive Plan chapter 4, future populations based on the Comprehensive Plan and projecting the same rate of growth into the future(2.45% per year). But the build-out population of the town is estimated to be about (2,312 current units + 3,100 future units) @2.32 persons per unit = 2,556.Growth in residential and commercial water demand is assumed to be proportional with the growth in population. System process water use is based on 0.0056MGD for distribution system uses and on the remainder being water plant processes (filter-to-waste and backwashing). Unaccounted-for water is projected to be reduced to approximately 36% by the year 2060 as the Town gradually replaces aging infrastructure and reduces system pressure where feasible. We assume a reduction of 0.02 MGD per decade as we replace infrastructure. Demand v/s Percent of Supply
| |
2024 |
2030 |
2040 |
2050 |
2060 |
2070 |
| Surface Water Supply |
0.2400 |
0.2400 |
0.2400 |
0.2400 |
0.2400 |
0.2400 |
| Ground Water Supply |
0.1040 |
0.1040 |
0.1040 |
0.1040 |
0.1040 |
0.1040 |
| Purchases |
0.0000 |
0.0000 |
0.0000 |
0.0000 |
0.0000 |
0.0000 |
| Future Supplies |
0.0000 |
0.0000 |
0.0000 |
0.0000 |
0.0000 |
| Total Available Supply (MGD) |
0.3440 |
0.3440 |
0.3440 |
0.3440 |
0.3440 |
0.3440 |
| Service Area Demand |
0.5197 |
0.6111 |
0.7548 |
0.8449 |
0.8854 |
0.8869 |
| Sales |
0.0000 |
0.0000 |
0.0000 |
0.0000 |
0.0000 |
0.0000 |
| Future Sales |
0.0000 |
0.0000 |
0.0000 |
0.0000 |
0.0000 |
| Total Demand (MGD) |
0.5197 |
0.6111 |
0.7548 |
0.8449 |
0.8854 |
0.8869 |
| Demand as Percent of Supply |
151% |
178% |
219% |
246% |
257% |
258% |

The purpose of the above chart is to show a general indication of how the long-term per capita water demand changes over time. The per capita water demand may actually be different than indicated due to seasonal populations and the accuracy of data submitted. Water systems that have calculated long-term per capita water demand based on a methodology that produces different results may submit their information in the notes field.
Your long-term water demand is 177 gallons per capita per day. What demand management practices do you plan to implement to reduce the per capita water demand (i.e. conduct regular water audits, implement a plumbing retrofit program, employ practices such as rainwater harvesting or reclaimed water)? If these practices are covered elsewhere in your plan, indicate where the practices are discussed here.
The 196 gpcd is based on the current residential demand of 0.133 MGD divided by the year-round population of 679. A more realistic estimation of per
capita water demand would be to divide the maximum day demand in December (1.088 MGD less non-residential uses of 0.359 MGD) by the estimated seasonal peak population of 5,569. This yields 131 gpcd.
Are there other demand management practices you will implement to reduce your future supply needs? Beech Mountain's system wide water loss is the primary reason for the high water demand. Virtually all of the substandard distribution water lines and service connections were installed by developers before the town was incorporated. As was done this year, the town plans to target and replace sections of the distribution system each year. Beech Mountain continues to operate with new accounting and billing practices in an effort to monitor and reduce water loss through digital meters and reading practices. The town continues to use leak detection equipment and practices to identify and repair water loss sources that are found.
What supplies other than the ones listed in future supplies are being considered to meet your future supply needs? The Town of Beech Mountain has sought assistance through the legislative House Bill 609 process in order to identify the town's future water supply needs and the options to meet these needs. Per the recommendation in the State's report, the town continues to work toward a potential emergency water intake on the Watauga River. The Town is also pursuing other options including groundwater wells and has begun construction on the Pinnacle Ridge Well site. This well has indicated that .104 MGD is the expected supply volume upon completed construction in March 2024.
Lake Coffey expansion project is currently underway with engineering and finance proposals. The town has progressed forward with this project and the financing is currently underway with FEMA. This project is expected to be complete in 2028 providing additional water supply for the town.
How does the water system intend to implement the demand management and supply planning components above? Beech Mountain has obtained a potential intake site on the Watauga River, which NC DWR has concurred is needed. Beech Mountain water lines and water taps are being systematically replaced over the course of several years. Beech Mountain water rates have been increased, and will need to continue to be increased.
Additional Information
Has this system participated in regional water supply or water use planning? No
What major water supply reports or studies were used for planning? own of Beech Mountain Water and Sewer Study by” Rothrock Engineering (P. Marion Rothrock,
P.E.date 2/28/2011).
Town of Beech Mountain -Buckeye Lake Yield Analysis by West Consultants dated February 7, 2014. Town of Beech Mountain Analysis of Future Water Supply Needs and Availability by the NC Division of Water Resources – Water Supply Planning Branch dated September 1, 2015. Beech Mountain Town Council Special Work Session Watauga Water Intake project Agenda Packet-February 25th 2020, 401 Water Quality Certification No. 1756 – November 2019.
Please describe any other needs or issues regarding your water supply sources, any water system deficiencies or needed improvements (storage, treatment, etc.) or your ability to meet present and future water needs. Include both quantity and quality considerations, as well as financial, technical, managerial, permitting, and compliance issues: According to the February 2014 Buckeye Lake Yield Analysis document by West Consultants, the safe yield of Buckeye Lake is approximately 0.3 mgd; however, this value is only valid under specific qualifying conditions. The most important condition is that this value does not include the existing minimum release requirements set forth in the United States Army Corps of Engineers (USACE) Permit (i.e., Section 404 of the Clean Water Act) for construction of the Buckeye Lake dam. The permit, issued November 1984, requires a minimum flow release from the dam of 2.8 cfs (1.8 mgd)
through October, November and December, intended to provide needed flows during the native brook trout spawning period. The remainder of the year (i.e., January through September), the required minimum release is 1.5 cfs (0.97 mgd), intended to maintain the existing water quality of Buckeye Creek. The 2014 Yield Analysis report makes it clear that when including the required minimum releases, as dictated by the USACE permit, the safe yield should be considered zero under low flow conditions or in times o drought. It should also be noted that similar to the Buckeye Creek flow estimations, the safe yield calculations used USGS gage data from the Watauga and Elk Rivers. In light of recent DWR modelling difficulties regarding Buckeye Creek, use of these values should be considered questionable, even though this methodology is the only available means to make such estimations.
The 1984 minimum release requirements used in the 2014 Buckeye Lake Yield Analysis document by West Consultants were not achievable during droughts such as the town experienced in 2010. Therefore, the town requested a modification to the dam permit issued by US Army Corps of Engineers. On November 20th, 2019 The Town of Beech Mountain received approval of Individual 401 Water Quality Certification (Certification #1756)(USACE Action ID. No. SAW-2018-02144) which replaces the certification based on October 8th, 1984. The new minimums approved are still significant (up to 1.64 MGD) but are more achievable. Based on this new certification protocol, West Consultants has re-calculated the estimated yield of Buckeye Lake to be 0.240 MGD. However, yields shown are theoretical and based on the assumption that the Buckeye Lake watershed characteristics mimic the Watauga River watershed. Actual yields may be lower.
In 2019 Beech Mountain moved forward to aid this calculation process by partnering with the U.S. Department of the Interior; U.S. Geological Survey to install and maintain stream gage stations upstream and downstream of the Buckeye Lake Reservoir. This data will be used to provide accurate stream flow calculations into the future aiding the ability to accurately meet USACE permit requirements. This data will be used to build a historical database for more accurate stream flow calculations.
The Division of Water Resources (DWR) provides the data contained within this
Local Water Supply Plan (LWSP) as a courtesy and service to our customers.
DWR staff does not field verify data. Neither DWR, nor any other party
involved in the preparation of this LWSP attests that the data is completely
free of errors and omissions. Furthermore, data users are cautioned that
LWSPs labeled PROVISIONAL have yet to be reviewed by DWR staff. Subsequent
review may result in significant revision. Questions regarding the accuracy
or limitations of usage of this data should be directed to the water system
and/or DWR.
|