|
The Division of Water Resources (DWR) provides the data contained within this
Local Water Supply Plan (LWSP) as a courtesy and service to our customers.
DWR staff does not field verify data. Neither DWR, nor any other party
involved in the preparation of this LWSP attests that the data is completely
free of errors and omissions. Furthermore, data users are cautioned that
LWSPs labeled PROVISIONAL have yet to be reviewed by DWR staff. Subsequent
review may result in significant revision. Questions regarding the accuracy
or limitations of usage of this data should be directed to the water system
and/or DWR.
1. System Information
Contact Information
Complete
| Water System Name: |
Burlington |
|
PWSID: |
02-01-010 |
| Mailing Address: | PO Box 1358
Burlington, NC 27216-1358 | Ownership: | Municipality |
| |
| Contact Person: | Robert Patterson | Title: | Water Resources Director |
| Phone: | 336-222-5130 | Cell/Mobile: | 336-516-2255 |
| |
| Secondary Contact: | Benjamin Bani | | Phone: | 336-222-5133 |
| Mailing Address: | PO. Box 1358
Burlington, NC 27216 | Cell/Mobile: | 336-516-2255 |
Distribution System
| Line Type |
Size Range (Inches) |
Estimated % of lines |
| Cast Iron |
4-36 |
4.43 % |
| Ductile Iron |
4-36 |
26.36 % |
| Galvanized Iron |
2 |
0.01 % |
| Other |
2-36 |
69.20 % |
In 2023 the estimated total miles of water lines were 441 miles whereas in 2024 the City recorded 440 miles as total miles of water line. The slight decrease in the estimated total miles of water lines was due to the removal of abandoned water lines from the inventory database. Also, the City is looking in identifying the water line type and updating the inventory accordingly. Programs
Water Conservation
2. Water Use Information
Service Area
| Sub-Basin(s) | % of Service Population |
|---|
| Haw River (02-1) | 100 % |
|
| County(s) | % of Service Population |
|---|
| Alamance | 99 % |
| Guilford | 1 % |
|
Water Use by Type
| Type of Use |
Metered
Connections |
Metered
Average Use (MGD) |
Non-Metered
Connections |
Non-Metered
Estimated Use (MGD) |
| Residential |
26,520 |
2.9729 |
0 |
0.0000 |
| Commercial |
1,785 |
3.3023 |
0 |
0.0000 |
| Industrial |
0 |
0.0000 |
0 |
0.0000 |
| Institutional |
0 |
0.0000 |
0 |
0.0000 |
How much water was used for system processes (backwash, line cleaning, flushing, etc.)? 1.5919 MGD
Currently, the City of Burlington Water system only distinguished between residential and commercial water meters. New billing software may allow sub-classifying commercial establishments. But this has not been verified as of this reporting. "System Process" is the total of the amount of water used at the water treatment plants for filter backwashing, basins washing, water quality flushing, sewer lines flushing, and etc. Also, it includes the total amount of water used by the Fire and Pack & recreation Departments, and water losses due to leakage and/ or water main breaks. Water Sales
| Purchaser |
PWSID |
Average
Daily Sold
(MGD) |
Days
Used |
Contract |
Required to
comply with water
use restrictions? |
Pipe Size(s)
(Inches) |
Use
Type |
| MGD |
Expiration |
Recurring |
| City of Graham |
02-01-015 |
1.2820 |
2 |
0.0000 |
|
Yes |
Yes |
8, 12 |
Emergency |
| City of Greensboro |
02-41-010 |
2.1047 |
366 |
5.0000 |
2028 |
Yes |
Yes |
24 |
Regular |
| Ossipee SD |
02-01-123 |
0.0387 |
366 |
0.1000 |
2035 |
Yes |
Yes |
12 |
Regular |
| Town of Elon |
02-01-025 |
0.7318 |
366 |
1.6000 |
2027 |
Yes |
Yes |
12 |
Regular |
| Town of Gibsonville |
02-41-025 |
0.6116 |
366 |
2.5000 |
2030 |
Yes |
Yes |
12 |
Regular |
| Town of Haw River |
02-01-020 |
0.7147 |
366 |
1.5000 |
2018 |
Yes |
Yes |
10,10 |
Regular |
| Village of Alamance |
02-01-035 |
0.0733 |
366 |
0.5000 |
|
Yes |
Yes |
8, 8 |
Regular |
| Whitsett |
30-41-089 |
0.0340 |
366 |
0.5000 |
2025 |
Yes |
Yes |
8 |
Regular |
3. Water Supply Sources
Monthly Withdrawals & Purchases
|
Average Daily
Use (MGD) |
Max Day
Use (MGD) |
|
Average Daily
Use (MGD) |
Max Day
Use (MGD) |
|
Average Daily
Use (MGD) |
Max Day
Use (MGD) |
| Jan |
12.5441 |
15.6310 |
May |
13.2075 |
16.4031 |
Sep |
14.7821 |
18.7731 |
| Feb |
11.9849 |
14.4029 |
Jun |
15.1757 |
17.8372 |
Oct |
15.4598 |
18.1950 |
| Mar |
11.4844 |
13.5159 |
Jul |
13.9196 |
17.4245 |
Nov |
13.9826 |
17.9073 |
| Apr |
12.0308 |
14.9816 |
Aug |
14.7345 |
18.2499 |
Dec |
13.2398 |
16.3860 |

Surface Water Sources
| Stream |
Reservoir |
Average Daily Withdrawal |
Maximum Day
Withdrawal (MGD) |
Available Raw
Water Supply |
Usable On-Stream
Raw Water Supply
Storage (MG) |
| MGD |
Days Used |
MGD |
* Qualifier |
| Great Alamance Creek |
Lake Mackintosh |
7.9884 |
365 |
15.2280 |
35.6000 |
SY50 |
5,141.0000 |
| Stoney Creek |
Stoney Creek Reservoir |
5.5805 |
366 |
9.6370 |
14.6000 |
SY50 |
2,450.0000 |
* Qualifier: C=Contract Amount, SY20=20-year Safe Yield, SY50=50-year Safe Yield, F=20% of 7Q10 or other instream flow requirement, CUA=Capacity Use Area Permit
Surface Water Sources (continued)
| Stream |
Reservoir |
Drainage Area
(sq mi) |
Metered? |
Sub-Basin |
County |
Year
Offline |
Use
Type |
| Great Alamance Creek |
Lake Mackintosh |
135 |
Yes |
Haw River (02-1) |
Alamance |
|
Regular |
| Stoney Creek |
Stoney Creek Reservoir |
95 |
Yes |
Haw River (02-1) |
Alamance |
|
Regular |
Water Purchases From Other Systems
| Seller |
PWSID |
Average
Daily Purchased
(MGD) |
Days
Used |
Contract |
Required to
comply with water
use restrictions? |
Pipe Size(s)
(Inches) |
Use
Type |
| MGD |
Expiration |
Recurring |
| City of Graham |
02-01-015 |
0.0021 |
366 |
0.0000 |
|
Yes |
Yes |
8, 12 |
Regular |
Water Treatment Plants
| Plant Name |
Permitted Capacity
(MGD) |
Is Raw Water Metered? |
Is Finished Water Ouput Metered? |
Source |
| Ed Thomas WTP |
16.0000 |
Yes |
Yes |
Stoney Creek Reservoir |
| J. D. Mackintosh, Jr WTP |
18.0000 |
Yes |
Yes |
Lake Mackintosh |
4. Wastewater Information
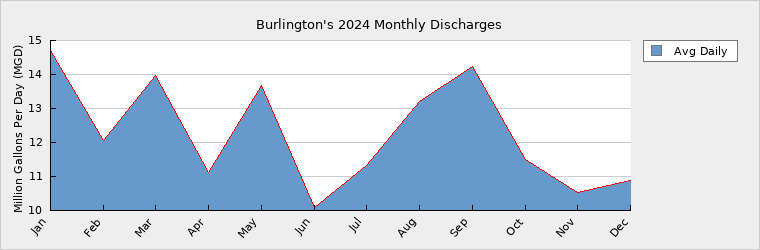
Monthly Discharges
|
Average Daily
Discharge (MGD) |
|
Average Daily
Discharge (MGD) |
|
Average Daily
Discharge (MGD) |
| Jan |
14.7106 |
May |
13.6824 |
Sep |
14.2457 |
| Feb |
12.0478 |
Jun |
10.0872 |
Oct |
11.5142 |
| Mar |
13.9754 |
Jul |
11.3179 |
Nov |
10.5152 |
| Apr |
11.1232 |
Aug |
13.2148 |
Dec |
10.8928 |
Wastewater Permits
| Permit Number |
Type |
Permitted Capacity
(MGD) |
Design Capacity
(MGD) |
Average Annual
Daily Discharge
(MGD) |
Maximum Day Discharge
(MGD) |
Receiving Stream |
Receiving Basin |
| NC0023868 |
WWTP |
12.0000 |
12.0000 |
4.4717 |
13.2730 |
Haw River |
Haw River (02-1) |
| NC0023876 |
WWTP |
12.0000 |
12.0000 |
7.4999 |
25.0800 |
Great Alamance Creek |
Haw River (02-1) |
| NCG590013 |
WTP |
0.0000 |
0.7500 |
0.3156 |
0.6920 |
Great Alamance Creek |
Haw River (02-1) |
Wastewater Interconnections
| Water System |
PWSID |
Type |
Average Daily Amount |
Contract
Maximum (MGD) |
| MGD |
Days Used |
| City of Graham |
02-01-015 |
Receiving |
0.2002 |
366 |
0.5000 |
| Green Level |
02-01-030 |
Receiving |
0.1434 |
366 |
0.2500 |
| Town of Elon |
02-01-025 |
Receiving |
0.6725 |
366 |
1.6000 |
| Town of Gibsonville |
02-41-025 |
Receiving |
0.7648 |
366 |
1.5500 |
| Town of Haw River |
02-01-020 |
Receiving |
0.2619 |
366 |
1.0000 |
| Town of Swepsonville |
30-01-005 |
Receiving |
0.2427 |
366 |
0.8000 |
| Village of Alamance |
02-01-035 |
Receiving |
0.0514 |
366 |
0.1440 |
5. Planning
Projections
| |
2024 |
2030 |
2040 |
2050 |
2060 |
2070 |
| Year-Round Population |
60,877 |
65,470 |
73,034 |
80,598 |
88,162 |
95,726 |
| Seasonal Population |
0 |
0 |
0 |
0 |
0 |
0 |
| |
| Residential |
2.9729 |
3.1250 |
3.2460 |
3.3190 |
3.3970 |
3.4340 |
| Commercial |
3.3023 |
3.4125 |
3.7050 |
4.0890 |
4.4560 |
4.8730 |
| Industrial |
0.0000 |
0.0000 |
0.0000 |
0.0000 |
0.0000 |
0.0000 |
| Institutional |
0.0000 |
0.0000 |
0.0000 |
0.0000 |
0.0000 |
0.0000 |
| System Process |
1.5919 |
1.5830 |
1.6120 |
1.6980 |
1.7120 |
1.7890 |
| Unaccounted-for |
1.3663 |
2.5983 |
2.6518 |
2.7173 |
2.7727 |
2.8367 |
Adjusted projected unaccounted-for demand to 11% of total demand which is the historical average. Future Water Sales
| Purchaser |
PWSID |
Contract |
Pipe Size(s) (Inches) |
Use Type |
| MGD |
Year Begin |
Year End |
| Greensboro |
02-41-010 |
1.8000 |
2030 |
|
|
Regular |
Demand v/s Percent of Supply
| |
2024 |
2030 |
2040 |
2050 |
2060 |
2070 |
| Surface Water Supply |
50.2000 |
50.2000 |
50.2000 |
50.2000 |
50.2000 |
50.2000 |
| Ground Water Supply |
0.0000 |
0.0000 |
0.0000 |
0.0000 |
0.0000 |
0.0000 |
| Purchases |
0.0021 |
0.0021 |
0.0021 |
0.0021 |
0.0021 |
0.0021 |
| Future Supplies |
0.0000 |
0.0000 |
0.0000 |
0.0000 |
0.0000 |
| Total Available Supply (MGD) |
50.2021 |
50.2021 |
50.2021 |
50.2021 |
50.2021 |
50.2021 |
| Service Area Demand |
9.2334 |
10.7188 |
11.2148 |
11.8233 |
12.3377 |
12.9327 |
| Sales |
4.3158 |
11.7000 |
11.7000 |
11.7000 |
11.7000 |
11.7000 |
| Future Sales |
1.8000 |
1.8000 |
1.8000 |
1.8000 |
1.8000 |
| Total Demand (MGD) |
13.5492 |
24.2188 |
24.7148 |
25.3233 |
25.8377 |
26.4327 |
| Demand as Percent of Supply |
27% |
48% |
49% |
50% |
51% |
53% |

The purpose of the above chart is to show a general indication of how the long-term per capita water demand changes over time. The per capita water demand may actually be different than indicated due to seasonal populations and the accuracy of data submitted. Water systems that have calculated long-term per capita water demand based on a methodology that produces different results may submit their information in the notes field.
Your long-term water demand is 49 gallons per capita per day. What demand management practices do you plan to implement to reduce the per capita water demand (i.e. conduct regular water audits, implement a plumbing retrofit program, employ practices such as rainwater harvesting or reclaimed water)? If these practices are covered elsewhere in your plan, indicate where the practices are discussed here.
Are there other demand management practices you will implement to reduce your future supply needs?
What supplies other than the ones listed in future supplies are being considered to meet your future supply needs?
How does the water system intend to implement the demand management and supply planning components above?
Additional Information
Has this system participated in regional water supply or water use planning? No
What major water supply reports or studies were used for planning?
Please describe any other needs or issues regarding your water supply sources, any water system deficiencies or needed improvements (storage, treatment, etc.) or your ability to meet present and future water needs. Include both quantity and quality considerations, as well as financial, technical, managerial, permitting, and compliance issues: The City of Burlington has contracted with an engineering firm to work on a-system wide water and sewer master plan with a 20 to 30-year planning window. The same engineering firm is also developing treatment and remediation solutions for the emerging contaminants found in the City's water system.
The Division of Water Resources (DWR) provides the data contained within this
Local Water Supply Plan (LWSP) as a courtesy and service to our customers.
DWR staff does not field verify data. Neither DWR, nor any other party
involved in the preparation of this LWSP attests that the data is completely
free of errors and omissions. Furthermore, data users are cautioned that
LWSPs labeled PROVISIONAL have yet to be reviewed by DWR staff. Subsequent
review may result in significant revision. Questions regarding the accuracy
or limitations of usage of this data should be directed to the water system
and/or DWR.
|