|
The Division of Water Resources (DWR) provides the data contained within this
Local Water Supply Plan (LWSP) as a courtesy and service to our customers.
DWR staff does not field verify data. Neither DWR, nor any other party
involved in the preparation of this LWSP attests that the data is completely
free of errors and omissions. Furthermore, data users are cautioned that
LWSPs labeled PROVISIONAL have yet to be reviewed by DWR staff. Subsequent
review may result in significant revision. Questions regarding the accuracy
or limitations of usage of this data should be directed to the water system
and/or DWR.
1. System Information
Contact Information
Complete
| Water System Name: |
Oxford |
|
PWSID: |
02-39-010 |
| Mailing Address: | PO BOX 506
Oxford, NC 27565 | Ownership: | Municipality |
| |
| Contact Person: | Ronald Parker | Title: | ORC |
| Phone: | 919-603-1152 | Cell/Mobile: | 919-939-3226 |
| |
| Secondary Contact: | Stephen Blasko | | Phone: | 919-603-1151 |
| Mailing Address: | PO Box 506
Oxford, NC 27565 | Cell/Mobile: | 919-482-2504 |
Distribution System
| Line Type |
Size Range (Inches) |
Estimated % of lines |
| Asbestos Cement |
16-20 |
3.13 % |
| Cast Iron |
4-6 |
22.18 % |
| Ductile Iron |
6-24 |
20.93 % |
| Galvanized Iron |
2 |
0.61 % |
| Polyvinyl Chloride |
2-12 |
53.15 % |
Programs
The City has started installing an AMI meter system. Water Conservation
The City of Oxford has an increasing block structure from 0 to 20,000 gallons and then a decreasing rate structure for over 20,001 gallons. We purchase water from KLRWS which is metered through two separate meters. The city has two separate feed lines from KLRWS. 2. Water Use Information
Service Area
| Sub-Basin(s) | % of Service Population |
|---|
| Tar River (15-1) | 100 % |
|
| County(s) | % of Service Population |
|---|
| Granville | 100 % |
|
Water Use by Type
| Type of Use |
Metered
Connections |
Metered
Average Use (MGD) |
Non-Metered
Connections |
Non-Metered
Estimated Use (MGD) |
| Residential |
3,486 |
0.3315 |
0 |
0.0000 |
| Commercial |
471 |
0.1881 |
0 |
0.0000 |
| Industrial |
40 |
0.2647 |
0 |
0.0000 |
| Institutional |
62 |
0.1375 |
0 |
0.0000 |
How much water was used for system processes (backwash, line cleaning, flushing, etc.)? 0.0244 MGD
Water Sales
| Purchaser |
PWSID |
Average
Daily Sold
(MGD) |
Days
Used |
Contract |
Required to
comply with water
use restrictions? |
Pipe Size(s)
(Inches) |
Use
Type |
| MGD |
Expiration |
Recurring |
| Town of Stovall |
02-39-018 |
0.0310 |
366 |
0.0750 |
2045 |
Yes |
Yes |
8 |
Regular |
3. Water Supply Sources
Monthly Withdrawals & Purchases
|
Average Daily
Use (MGD) |
Max Day
Use (MGD) |
|
Average Daily
Use (MGD) |
Max Day
Use (MGD) |
|
Average Daily
Use (MGD) |
Max Day
Use (MGD) |
| Jan |
0.9016 |
1.2888 |
May |
1.0827 |
1.5825 |
Sep |
1.1522 |
1.8170 |
| Feb |
1.0013 |
1.3989 |
Jun |
1.2341 |
2.2894 |
Oct |
1.1811 |
2.2985 |
| Mar |
1.0068 |
1.9243 |
Jul |
1.1612 |
2.1479 |
Nov |
1.0529 |
1.8630 |
| Apr |
0.9682 |
1.8663 |
Aug |
1.3870 |
3.0204 |
Dec |
0.9782 |
1.6827 |

Water Purchases From Other Systems
| Seller |
PWSID |
Average
Daily Purchased
(MGD) |
Days
Used |
Contract |
Required to
comply with water
use restrictions? |
Pipe Size(s)
(Inches) |
Use
Type |
| MGD |
Expiration |
Recurring |
| Kerr Lake Regional Water System |
02-91-010 |
1.0927 |
366 |
2.0000 |
2047 |
Yes |
Yes |
20 |
Regular |
4. Wastewater Information
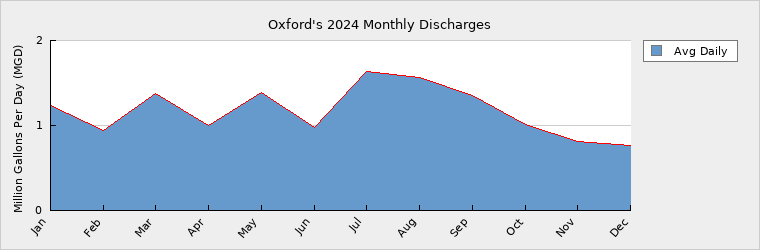
Monthly Discharges
|
Average Daily
Discharge (MGD) |
|
Average Daily
Discharge (MGD) |
|
Average Daily
Discharge (MGD) |
| Jan |
1.2400 |
May |
1.3900 |
Sep |
1.3500 |
| Feb |
0.9400 |
Jun |
0.9710 |
Oct |
1.0100 |
| Mar |
1.3800 |
Jul |
1.6400 |
Nov |
0.8100 |
| Apr |
1.0000 |
Aug |
1.5600 |
Dec |
0.7700 |
Wastewater Permits
| Permit Number |
Type |
Permitted Capacity
(MGD) |
Design Capacity
(MGD) |
Average Annual
Daily Discharge
(MGD) |
Maximum Day Discharge
(MGD) |
Receiving Stream |
Receiving Basin |
| NC0025054 |
WWTP |
3.5000 |
8.7500 |
1.1700 |
7.9000 |
Fishing Creek |
Tar River (15-1) |
5. Planning
Projections
| |
2024 |
2030 |
2040 |
2050 |
2060 |
2070 |
| Year-Round Population |
8,721 |
9,524 |
9,912 |
10,841 |
11,857 |
12,968 |
| Seasonal Population |
0 |
0 |
0 |
0 |
0 |
0 |
| |
| Residential |
0.3315 |
0.3385 |
0.3684 |
0.4010 |
0.4385 |
0.4820 |
| Commercial |
0.1881 |
0.1938 |
0.2140 |
0.2365 |
0.2612 |
0.2886 |
| Industrial |
0.2647 |
0.2663 |
0.2690 |
0.2717 |
0.2744 |
0.2772 |
| Institutional |
0.1375 |
0.1383 |
0.1397 |
0.1411 |
0.1425 |
0.1498 |
| System Process |
0.0244 |
0.0244 |
0.0247 |
0.0257 |
0.0267 |
0.0290 |
| Unaccounted-for |
0.1155 |
0.1300 |
0.1436 |
0.1586 |
0.1752 |
0.1936 |
Future Supply Sources
| Source Name |
PWSID |
Source Type |
Additional Supply |
Year Online |
Year Offline |
Type |
| Kerr Lake Regional |
02-91-010 |
Surface |
2.0000 |
2020 |
2100 |
Regular |
Demand v/s Percent of Supply
| |
2024 |
2030 |
2040 |
2050 |
2060 |
2070 |
| Surface Water Supply |
0.0000 |
0.0000 |
0.0000 |
0.0000 |
0.0000 |
0.0000 |
| Ground Water Supply |
0.0000 |
0.0000 |
0.0000 |
0.0000 |
0.0000 |
0.0000 |
| Purchases |
2.0000 |
2.0000 |
2.0000 |
2.0000 |
2.0000 |
2.0000 |
| Future Supplies |
2.0000 |
2.0000 |
2.0000 |
2.0000 |
2.0000 |
| Total Available Supply (MGD) |
2.0000 |
4.0000 |
4.0000 |
4.0000 |
4.0000 |
4.0000 |
| Service Area Demand |
1.0617 |
1.0913 |
1.1594 |
1.2346 |
1.3185 |
1.4202 |
| Sales |
0.0310 |
0.0750 |
0.0750 |
0.0750 |
0.0750 |
0.0750 |
| Future Sales |
0.0000 |
0.0000 |
0.0000 |
0.0000 |
0.0000 |
| Total Demand (MGD) |
1.0927 |
1.1663 |
1.2344 |
1.3096 |
1.3935 |
1.4952 |
| Demand as Percent of Supply |
55% |
29% |
31% |
33% |
35% |
37% |

The purpose of the above chart is to show a general indication of how the long-term per capita water demand changes over time. The per capita water demand may actually be different than indicated due to seasonal populations and the accuracy of data submitted. Water systems that have calculated long-term per capita water demand based on a methodology that produces different results may submit their information in the notes field.
Your long-term water demand is 38 gallons per capita per day. What demand management practices do you plan to implement to reduce the per capita water demand (i.e. conduct regular water audits, implement a plumbing retrofit program, employ practices such as rainwater harvesting or reclaimed water)? If these practices are covered elsewhere in your plan, indicate where the practices are discussed here.
no changes
Are there other demand management practices you will implement to reduce your future supply needs? The City of Oxford does a water audit every three to five years.
What supplies other than the ones listed in future supplies are being considered to meet your future supply needs? Kerr Lake Regional water plant expansion is currently under construction.
How does the water system intend to implement the demand management and supply planning components above?
Additional Information
Has this system participated in regional water supply or water use planning? Yes, An inter basin transfer study was done in 2015 KLRWS for Henderson, Oxford and Warren County for an increase in the withdrawal allowed at Kerr Lake from 10mgd to 20mgd. The plant expansion is currently under construction. At completion Oxford will receive 2mgd.
What major water supply reports or studies were used for planning? Kerr Lake Regional water study by CH2M Hill. The city completed an assessment plan and a 10 year CIP.
Please describe any other needs or issues regarding your water supply sources, any water system deficiencies or needed improvements (storage, treatment, etc.) or your ability to meet present and future water needs. Include both quantity and quality considerations, as well as financial, technical, managerial, permitting, and compliance issues: Over the past 8 Years the city has replaced miles of water lines. These projects are still on going and was done with grants and loans through DWI and USDA.
The Division of Water Resources (DWR) provides the data contained within this
Local Water Supply Plan (LWSP) as a courtesy and service to our customers.
DWR staff does not field verify data. Neither DWR, nor any other party
involved in the preparation of this LWSP attests that the data is completely
free of errors and omissions. Furthermore, data users are cautioned that
LWSPs labeled PROVISIONAL have yet to be reviewed by DWR staff. Subsequent
review may result in significant revision. Questions regarding the accuracy
or limitations of usage of this data should be directed to the water system
and/or DWR.
|