|
The Division of Water Resources (DWR) provides the data contained within this
Local Water Supply Plan (LWSP) as a courtesy and service to our customers.
DWR staff does not field verify data. Neither DWR, nor any other party
involved in the preparation of this LWSP attests that the data is completely
free of errors and omissions. Furthermore, data users are cautioned that
LWSPs labeled PROVISIONAL have yet to be reviewed by DWR staff. Subsequent
review may result in significant revision. Questions regarding the accuracy
or limitations of usage of this data should be directed to the water system
and/or DWR.
1. System Information
Contact Information
Complete
| Water System Name: |
Greensboro |
|
PWSID: |
02-41-010 |
| Mailing Address: | PO Box 3136
Greensboro, NC 27402 | Ownership: | Municipality |
| |
| Contact Person: | Scott Jewell | Title: | Water Supply Manager |
| Phone: | 336-373-7900 | Cell/Mobile: | 336-430-6550 |
| |
| Secondary Contact: | Earl Green | | Phone: | 336-373-7909 |
| Mailing Address: | 1041 Battleground Ave
Greensboro, NC 27408 | Cell/Mobile: | 336-430-6550 |
Distribution System
| Line Type |
Size Range (Inches) |
Estimated % of lines |
| Cast Iron |
2-42 |
36.00 % |
| Ductile Iron |
2-60 |
61.00 % |
| Other |
.7-48 |
2.00 % |
| Polyvinyl Chloride |
.7-12 |
1.00 % |
Numbers received from the Engineering and Customer Services Division.
How many meters were replaced in 2024: In-House (5,587) and Concord/AMI program (43,405) = Combined 48,992
Total miles of City Owned Water Lines (1,530) Total miles of City and Private Owned Water Lines (1,891) Programs
For the last six years, the City is working on water audit using AWWA software.
In the process of upgrading master meters with better technology and installing zone meters in the distribution system.
The City of Greensboro is in the process of hiring leak detection consultants. Water Conservation
2. Water Use Information
Service Area
| Sub-Basin(s) | % of Service Population |
|---|
| Haw River (02-1) | 93 % |
| Deep River (02-2) | 7 % |
|
| County(s) | % of Service Population |
|---|
| Guilford | 100 % |
|
The year-round population served is calculated from the City population and the population served in Guilford County. The city population for 2024, estimated by the City Planning Department, is 301,115 (Planning will have the population in May 2025). Population served outside the City in Guilford County was 14,726 (calculated as outside City connection 6,011 x 2.49 = 14,967). 2.49 is the average population per household in Guilford County. So the population served in 2024 was 301,115 + 14,967 = 316,082. The estimated numbers of City population and average population per household in Guilford County have been provided by City Planning Division. Water Use by Type
| Type of Use |
Metered
Connections |
Metered
Average Use (MGD) |
Non-Metered
Connections |
Non-Metered
Estimated Use (MGD) |
| Residential |
100,549 |
17.3400 |
0 |
0.0000 |
| Commercial |
9,107 |
9.8900 |
0 |
0.0000 |
| Industrial |
53 |
1.8000 |
0 |
0.0000 |
| Institutional |
294 |
0.9400 |
0 |
0.0000 |
How much water was used for system processes (backwash, line cleaning, flushing, etc.)? 2.6146 MGD
In calculating the system process the following were considered.
Townsend lagoon effluent (262.51 MG), Wash Water from Mithcell Plant (31.24 MG), Mitchell waste (estimate) (42.59 MG), Distribution System Flushed (524,243,747 MG), Distribution System Wasted (85,436,831 MG), Fire Department Hydrant Annual Flushing (8,153,260 GAL), Water wasted for distribution tanks servicing (Muris Chapel 99,495 GAL and Groometown Tank 83,160 GAL). Total 954,356,493/365 = 2.6146 Water Sales
| Purchaser |
PWSID |
Average
Daily Sold
(MGD) |
Days
Used |
Contract |
Required to
comply with water
use restrictions? |
Pipe Size(s)
(Inches) |
Use
Type |
| MGD |
Expiration |
Recurring |
| City of Burlington |
02-01-010 |
0.0000 |
0 |
0.0000 |
2028 |
Yes |
Yes |
12,16 |
Emergency |
| City of Reidsville |
02-79-020 |
0.0000 |
0 |
0.0000 |
2029 |
No |
Yes |
30 |
Emergency |
| Town of Jamestown |
02-41-030 |
0.1250 |
365 |
0.1250 |
|
Yes |
Yes |
12 |
Regular |
Jamestown purchases water from PTRWA (allocation of 0.775 MGD) via the distribution lines of High Point and Greensboro. Jamestown is obligated to purchase or pay for 0.500 MGD from PTRWA, and this amount is included in the 2.780 MGD (2.28 MGD firm allocation for High Point + 0.5 MGD for Jamestown) sales contract with High Point. Jamestown routes 0.125 MGD through Greensboro, and this amount is included in the 7.9355 MGD sales contract with Greensboro (7.83 MGD + 0.125 MGD). 7.83 MGD is the firm allocation for Greensboro and 0.125 MGD is additional water for Jamestown above the firm allocation or requested amount, whichever is greater.
The Jamestown contract value (0.15 MGD) is the difference between the allocated amount (0.775 MGD) and the sum of the obligated contract amount (0.500 MGD), and water routed through Greensboro (0.125 MGD).
3. Water Supply Sources
Monthly Withdrawals & Purchases
|
Average Daily
Use (MGD) |
Max Day
Use (MGD) |
|
Average Daily
Use (MGD) |
Max Day
Use (MGD) |
|
Average Daily
Use (MGD) |
Max Day
Use (MGD) |
| Jan |
32.3602 |
39.4789 |
May |
36.6327 |
44.1836 |
Sep |
36.9162 |
41.3888 |
| Feb |
31.7784 |
35.5487 |
Jun |
39.5910 |
47.7877 |
Oct |
38.6087 |
48.1185 |
| Mar |
31.5834 |
36.2290 |
Jul |
40.5636 |
49.0249 |
Nov |
36.2606 |
42.4922 |
| Apr |
35.7834 |
40.7794 |
Aug |
37.7848 |
51.1644 |
Dec |
33.3326 |
38.5372 |
The numbers were collected from the Water Supply Database. Totals include raw water withdrawals from the lakes by Townsend and Mitchell, as well as purchased water from our Partners. 
Surface Water Sources
| Stream |
Reservoir |
Average Daily Withdrawal |
Maximum Day
Withdrawal (MGD) |
Available Raw
Water Supply |
Usable On-Stream
Raw Water Supply
Storage (MG) |
| MGD |
Days Used |
MGD |
* Qualifier |
| Brush Creek. |
Lake Higgins |
0.0000 |
0 |
0.0000 |
0.0000 |
SY50 |
792.0000 |
| Reedy Fork Cr. |
Lake Townsend |
17.6824 |
365 |
23.5810 |
24.0000 |
SY50 |
5,385.0000 |
| Reedy Fork Cr.Horsepen Cr. |
Lake Brandt |
8.3206 |
365 |
19.0900 |
12.0000 |
SY50 |
1,752.0000 |
* Qualifier: C=Contract Amount, SY20=20-year Safe Yield, SY50=50-year Safe Yield, F=20% of 7Q10 or other instream flow requirement, CUA=Capacity Use Area Permit
Surface Water Sources (continued)
| Stream |
Reservoir |
Drainage Area
(sq mi) |
Metered? |
Sub-Basin |
County |
Year
Offline |
Use
Type |
| Brush Creek. |
Lake Higgins |
11 |
No |
Haw River (02-1) |
Guilford |
2018 |
Emergency |
| Reedy Fork Cr. |
Lake Townsend |
59 |
Yes |
Haw River (02-1) |
Guilford |
|
Regular |
| Reedy Fork Cr.Horsepen Cr. |
Lake Brandt |
35 |
Yes |
Haw River (02-1) |
Guilford |
|
Regular |
Lake stage above 714.5 ft, the release is 7.1 cfs; Lake stage below 714.5 ft, the release is 3.5 cfs; with mandatory water restrictions, the release is 2.9 cfs. Water Purchases From Other Systems
| Seller |
PWSID |
Average
Daily Purchased
(MGD) |
Days
Used |
Contract |
Required to
comply with water
use restrictions? |
Pipe Size(s)
(Inches) |
Use
Type |
| MGD |
Expiration |
Recurring |
| City of Burlington |
02-01-010 |
2.1047 |
365 |
5.0000 |
2028 |
Yes |
Yes |
12,16 |
Regular |
| City of High Point |
02-41-020 |
0.0000 |
0 |
0.0000 |
|
Yes |
Yes |
12,12 |
Emergency |
| City of Reidsville |
02-79-020 |
1.0280 |
363 |
1.0000 |
2029 |
Yes |
Yes |
30 |
Regular |
| City of Winston-Salem |
02-34-010 |
0.0000 |
0 |
3.0000 |
2030 |
Yes |
Yes |
12 |
Emergency |
| Piedmont Triad Regional Water Authority |
30-76-010 |
6.9166 |
362 |
7.9550 |
2057 |
Yes |
Yes |
48 |
Regular |
The numbers have been verified and match Burlington and Reidsville. PTRWA is currently working on its LWSP.
The contract purchases from PTRWA (7.955 MGD) consist of 7.83 MGD, the firm allocation for Greensboro, and 0.125, which is additional water for Jamestown. Water Treatment Plants
| Plant Name |
Permitted Capacity
(MGD) |
Is Raw Water Metered? |
Is Finished Water Ouput Metered? |
Source |
| Lake Townsend WTP |
30.0000 |
Yes |
Yes |
Haw River Basin-Reedy Fork Creek |
| Mitchell Water Treatment Plant |
24.0000 |
Yes |
Yes |
Haw River Basin-Reedy Fork Creek |
4. Wastewater Information
Monthly Discharges
|
Average Daily
Discharge (MGD) |
|
Average Daily
Discharge (MGD) |
|
Average Daily
Discharge (MGD) |
| Jan |
40.5689 |
May |
39.2838 |
Sep |
38.4172 |
| Feb |
35.9467 |
Jun |
32.3112 |
Oct |
36.2596 |
| Mar |
39.6038 |
Jul |
34.6844 |
Nov |
34.0632 |
| Apr |
35.1899 |
Aug |
39.9651 |
Dec |
34.2715 |
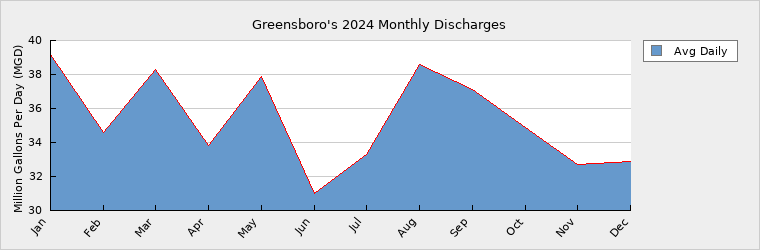
Updated information related to connections and plans to build or expand is needed.
Numbers were obtained from the Water Reclamation Division and Customer Services Division.
Greensboro has no Land Application permit since the sludge is incinerated using Fluidized Bed Incinerators.
The monthly averages were adjusted to include discharge from the wastewater interconnections (High Point and Jamestown).
The monthly average discharge numbers were adjusted to align with the reported average annual discharge numbers. Wastewater Permits
| Permit Number |
Type |
Permitted Capacity
(MGD) |
Design Capacity
(MGD) |
Average Annual
Daily Discharge
(MGD) |
Maximum Day Discharge
(MGD) |
Receiving Stream |
Receiving Basin |
| NC0047384 |
WWTP |
56.0000 |
56.0000 |
35.4000 |
89.7000 |
South Buffalo Creek |
Haw River (02-1) |
| NC0081426 |
WTP |
2.0000 |
1.5000 |
0.0000 |
0.0000 |
North Buffalo Creek |
Haw River (02-1) |
| NCG590017 |
WTP |
2.8900 |
32.0000 |
0.7172 |
3.2000 |
Reedy Fork Cr. |
Haw River (02-1) |
NC0081426 - Mitchell
NCG590017 - Townsend Wastewater Interconnections
| Water System |
PWSID |
Type |
Average Daily Amount |
Contract
Maximum (MGD) |
| MGD |
Days Used |
| City of High Point |
02-41-020 |
Discharging |
0.1100 |
365 |
|
| Town of Jamestown |
02-41-030 |
Discharging |
0.5140 |
365 |
|
| City of Burlington |
02-01-010 |
Receiving |
0.1270 |
365 |
0.9000 |
5. Planning
Projections
| |
2024 |
2030 |
2040 |
2050 |
2060 |
2070 |
| Year-Round Population |
316,082 |
349,184 |
382,790 |
419,630 |
460,015 |
504,287 |
| Seasonal Population |
0 |
0 |
0 |
0 |
0 |
0 |
| |
| Residential |
17.3400 |
18.1650 |
20.0400 |
22.0100 |
24.1400 |
26.1600 |
| Commercial |
9.8900 |
10.0800 |
11.0900 |
12.4100 |
13.1400 |
14.0100 |
| Industrial |
1.8000 |
1.9000 |
2.9000 |
3.0100 |
3.3000 |
3.5000 |
| Institutional |
0.9400 |
0.9920 |
1.1400 |
1.2000 |
1.4000 |
1.5000 |
| System Process |
2.6146 |
3.5600 |
3.5600 |
3.5600 |
3.5600 |
3.5600 |
| Unaccounted-for |
3.1822 |
2.8900 |
2.8600 |
2.7700 |
2.6500 |
2.8300 |
These projections have been considered by the B&V in conduction "A capacity development study" for the City of Greensboro in the year of 2020.
Per agreement, total allocation from PTRWA is 25.5 MGD.
Per agreement, maximum purchase amount from Burlington is 5.0 MGD. They will be increasing their allocation by 1.8 MGD by 20230 making the max purchase of 6.8 MGD.
Per agreement, minimum purchase amount from Reidsville is 1.o MGD. The are planning to provide another 4.0 MGD by 2040.
2030 projected institutional demand was adjusted from 0.0992 MGD to 0.992 MGD as shown in the 2022 LWSP. Future Supply Sources
| Source Name |
PWSID |
Source Type |
Additional Supply |
Year Online |
Year Offline |
Type |
| Burlington |
02-01-010 |
Purchase |
1.8000 |
2030 |
|
Regular |
| PTRWA |
36-76-010 |
Purchase |
10.6800 |
2030 |
|
Regular |
| PTRWA |
36-76-010 |
Purchase |
10.6800 |
2040 |
|
Regular |
| PTRWA |
36-76-010 |
Purchase |
10.6800 |
2050 |
|
Regular |
| Reidsville |
02-79-020 |
Purchase |
4.0000 |
2040 |
|
Regular |
Demand v/s Percent of Supply
| |
2024 |
2030 |
2040 |
2050 |
2060 |
2070 |
| Surface Water Supply |
36.0000 |
36.0000 |
36.0000 |
36.0000 |
36.0000 |
36.0000 |
| Ground Water Supply |
0.0000 |
0.0000 |
0.0000 |
0.0000 |
0.0000 |
0.0000 |
| Purchases |
13.9550 |
13.9830 |
13.9830 |
13.9830 |
13.9830 |
13.9830 |
| Future Supplies |
12.4800 |
27.1600 |
37.8400 |
37.8400 |
37.8400 |
| Total Available Supply (MGD) |
49.9550 |
62.4630 |
77.1430 |
87.8230 |
87.8230 |
87.8230 |
| Service Area Demand |
35.7668 |
37.5870 |
41.5900 |
44.9600 |
48.1900 |
51.5600 |
| Sales |
0.1247 |
0.1250 |
0.1250 |
0.1250 |
0.1250 |
0.1250 |
| Future Sales |
0.0000 |
0.0000 |
0.0000 |
0.0000 |
0.0000 |
| Total Demand (MGD) |
35.8915 |
37.7120 |
41.7150 |
45.0850 |
48.3150 |
51.6850 |
| Demand as Percent of Supply |
72% |
60% |
54% |
51% |
55% |
59% |

The purpose of the above chart is to show a general indication of how the long-term per capita water demand changes over time. The per capita water demand may actually be different than indicated due to seasonal populations and the accuracy of data submitted. Water systems that have calculated long-term per capita water demand based on a methodology that produces different results may submit their information in the notes field.
Your long-term water demand is 55 gallons per capita per day. What demand management practices do you plan to implement to reduce the per capita water demand (i.e. conduct regular water audits, implement a plumbing retrofit program, employ practices such as rainwater harvesting or reclaimed water)? If these practices are covered elsewhere in your plan, indicate where the practices are discussed here.
The City of Greensboro is participating yearly in regular water audits as per AWWA software.
Are there other demand management practices you will implement to reduce your future supply needs? In the process of upgrading master flow meters with better technology and installing zone meters in the distribution system.
What supplies other than the ones listed in future supplies are being considered to meet your future supply needs? No other supplies have been planned at this stage.
How does the water system intend to implement the demand management and supply planning components above? A project is underway at the Mitchell Plant to improve plant output with improved quality. The project includes modification of Flash chambers including improved flocculators, modifications of settling basins by installing plate settlers. A Generator has been installed at the Piedmont Triad Regional Water Authority (PTRWA), City of Burlington, City of High Point, City of Reidsville, City of Winston Salem and Jamestown.
Additional Information
Has this system participated in regional water supply or water use planning? Yes, The City of Greensboro is participating in a Regional Water Supply Planning through partnership with surrounding utilities and Water Authority. These are Piedmont Triad Regional Water Authority (PTRWA), City of Burlington, City of High Point, City of Reidsville, City of Winston Salem and Jamestown.
What major water supply reports or studies were used for planning? The study conducted by Black and Veatch (B$V) on "Water Resources Capacity Development Study" for the City of Greensboro in 2020.
Please describe any other needs or issues regarding your water supply sources, any water system deficiencies or needed improvements (storage, treatment, etc.) or your ability to meet present and future water needs. Include both quantity and quality considerations, as well as financial, technical, managerial, permitting, and compliance issues: A project is underway to install a second Clearwell for filtered water at Townsend Plant. This will allow for the inspection/repair of one of two Clearwells at any time while keeping the plant running.
The Division of Water Resources (DWR) provides the data contained within this
Local Water Supply Plan (LWSP) as a courtesy and service to our customers.
DWR staff does not field verify data. Neither DWR, nor any other party
involved in the preparation of this LWSP attests that the data is completely
free of errors and omissions. Furthermore, data users are cautioned that
LWSPs labeled PROVISIONAL have yet to be reviewed by DWR staff. Subsequent
review may result in significant revision. Questions regarding the accuracy
or limitations of usage of this data should be directed to the water system
and/or DWR.
|