|
The Division of Water Resources (DWR) provides the data contained within this
Local Water Supply Plan (LWSP) as a courtesy and service to our customers.
DWR staff does not field verify data. Neither DWR, nor any other party
involved in the preparation of this LWSP attests that the data is completely
free of errors and omissions. Furthermore, data users are cautioned that
LWSPs labeled PROVISIONAL have yet to be reviewed by DWR staff. Subsequent
review may result in significant revision. Questions regarding the accuracy
or limitations of usage of this data should be directed to the water system
and/or DWR.
1. System Information
Contact Information
Complete
| Water System Name: |
Jamestown |
|
PWSID: |
02-41-030 |
| Mailing Address: | P.O. Box 848
Jamestown, NC 27282 | Ownership: | Municipality |
| |
| Contact Person: | Paul Blanchard | Title: | Public Services Director |
| Phone: | 336-454-1138 | Cell/Mobile: | 336-669-7398 |
| |
| Secondary Contact: | Jamie Johnson | | Phone: | 336-454-1138 |
| Mailing Address: | P.O. Box 848
Jamestown, NC 27282 | Cell/Mobile: | 336-669-7398 |
Distribution System
| Line Type |
Size Range (Inches) |
Estimated % of lines |
| Asbestos Cement |
4-12 |
8.00 % |
| Cast Iron |
6-8 |
11.00 % |
| Ductile Iron |
6-12 |
32.00 % |
| Polyvinyl Chloride |
2-12 |
49.00 % |
Programs
We use AMR to detect leaks, and we read meters twice monthly. We have the ability to download data from meters, and the software is useful in showing high usage and changes in usage. We are currently upgrading to AMI. Water Conservation
2. Water Use Information
Service Area
| Sub-Basin(s) | % of Service Population |
|---|
| Deep River (02-2) | 100 % |
|
| County(s) | % of Service Population |
|---|
| Guilford | 100 % |
|
Water Use by Type
| Type of Use |
Metered
Connections |
Metered
Average Use (MGD) |
Non-Metered
Connections |
Non-Metered
Estimated Use (MGD) |
| Residential |
2,541 |
0.3160 |
0 |
0.0000 |
| Commercial |
142 |
0.0730 |
0 |
0.0000 |
| Industrial |
7 |
0.0550 |
3 |
0.0000 |
| Institutional |
18 |
0.0290 |
1 |
0.0000 |
How much water was used for system processes (backwash, line cleaning, flushing, etc.)? 0.0350 MGD
3. Water Supply Sources
Monthly Withdrawals & Purchases
|
Average Daily
Use (MGD) |
Max Day
Use (MGD) |
|
Average Daily
Use (MGD) |
Max Day
Use (MGD) |
|
Average Daily
Use (MGD) |
Max Day
Use (MGD) |
| Jan |
0.4740 |
|
May |
0.5460 |
|
Sep |
0.5840 |
|
| Feb |
0.4780 |
|
Jun |
0.6640 |
|
Oct |
0.5980 |
|
| Mar |
0.4910 |
|
Jul |
0.6680 |
|
Nov |
0.6010 |
|
| Apr |
0.5040 |
|
Aug |
0.6020 |
|
Dec |
0.5200 |
|

Water Purchases From Other Systems
| Seller |
PWSID |
Average
Daily Purchased
(MGD) |
Days
Used |
Contract |
Required to
comply with water
use restrictions? |
Pipe Size(s)
(Inches) |
Use
Type |
| MGD |
Expiration |
Recurring |
| Greensboro |
02-41-010 |
0.1040 |
366 |
0.1250 |
|
Yes |
Yes |
12 |
Regular |
| High Point |
02-41-020 |
0.4570 |
366 |
1.5000 |
|
Yes |
Yes |
12 |
Regular |
| PTRWA |
30-76-010 |
0.0000 |
366 |
0.1500 |
2057 |
Yes |
Yes |
12 |
Regular |
We purchase most of our water from PTRWA, and that water is routed through the distribution system lines of Greensboro and High Point. Any additional water need is purchased from High Point via a separate 1.0 MGD contract. We are obligated to purchase 0.594 MGD from PTRWA, but we do not use that much water most of the time. We route 0.500 MGD through High Point and 0.125 MGD through Greensboro. Jamestown has an allocation of 0.775 MGD from PTRWA. Since we route 0.500 MGD through High Point and 0.125 MGD through Greensboro, the remainder (0.150 MGD) is shown as the contract from PTRWA. 4. Wastewater Information
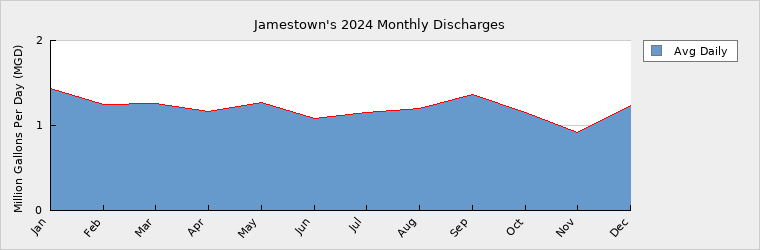
Monthly Discharges
|
Average Daily
Discharge (MGD) |
|
Average Daily
Discharge (MGD) |
|
Average Daily
Discharge (MGD) |
| Jan |
1.4330 |
May |
1.2730 |
Sep |
1.3660 |
| Feb |
1.2460 |
Jun |
1.0850 |
Oct |
1.1560 |
| Mar |
1.2610 |
Jul |
1.1560 |
Nov |
0.9140 |
| Apr |
1.1600 |
Aug |
1.1990 |
Dec |
1.2380 |
The Town of Jamestown is a capital partner with the City of High Point in the High Point Eastside Wastewater Treatment Plant. The Town will participate in the cost of the planned upgrades and improvements to the plant.
We have many more sewer customers than water customers. We serve a large development in Greensboro with sewer. We currently serve about 2,361 Greensboro customers with sewer. (In 2021 we served about 2,639 Greensboro customers before a pump station relocation). Wastewater Permits
| Permit Number |
Type |
Permitted Capacity
(MGD) |
Design Capacity
(MGD) |
Average Annual
Daily Discharge
(MGD) |
Maximum Day Discharge
(MGD) |
Receiving Stream |
Receiving Basin |
| WQCS00314 |
CS |
2.0000 |
4.1400 |
0.0000 |
|
Deep River |
Deep River (02-2) |
Wastewater discharge is accounted for in the wastewater interconnection section below. Wastewater Interconnections
| Water System |
PWSID |
Type |
Average Daily Amount |
Contract
Maximum (MGD) |
| MGD |
Days Used |
| High Point |
02-41-020 |
Discharging |
1.2070 |
366 |
2.0000 |
| City of Greensboro |
02-41-010 |
Receiving |
0.5500 |
366 |
0.7750 |
We do not have a contract maximum for the Greensboro discharge we receive. We used our maximum purchase amount from PTRWA (0.775 MGD). 5. Planning
Projections
| |
2024 |
2030 |
2040 |
2050 |
2060 |
2070 |
| Year-Round Population |
6,543 |
10,000 |
10,500 |
11,000 |
11,500 |
12,000 |
| Seasonal Population |
0 |
0 |
0 |
0 |
0 |
0 |
| |
| Residential |
0.3160 |
0.4600 |
0.4800 |
0.5000 |
0.5200 |
0.5400 |
| Commercial |
0.0730 |
0.1200 |
0.1400 |
0.1600 |
0.1800 |
0.2000 |
| Industrial |
0.0550 |
0.0800 |
0.0800 |
0.0800 |
0.0800 |
0.0800 |
| Institutional |
0.0290 |
0.0450 |
0.0600 |
0.0750 |
0.0800 |
0.0850 |
| System Process |
0.0350 |
0.0350 |
0.0350 |
0.0350 |
0.0350 |
0.0350 |
| Unaccounted-for |
0.0530 |
0.0772 |
0.0829 |
0.0887 |
0.0934 |
0.0981 |
Future Supply Sources
| Source Name |
PWSID |
Source Type |
Additional Supply |
Year Online |
Year Offline |
Type |
| PTRWA |
30-76-010 |
Purchase |
0.4250 |
2028 |
|
Regular |
The Town of Jamestown may increase its purchase contract with PTRWA when the plant is expanded around 2028. In the original agreement, Jamestown had an interest in 1.200 MGD, which appears to be accurate to provide for future water needs. Currently, Jamestown has 0.775 MGD of the future 1.200 MGD capacity. Demand v/s Percent of Supply
| |
2024 |
2030 |
2040 |
2050 |
2060 |
2070 |
| Surface Water Supply |
0.0000 |
0.0000 |
0.0000 |
0.0000 |
0.0000 |
0.0000 |
| Ground Water Supply |
0.0000 |
0.0000 |
0.0000 |
0.0000 |
0.0000 |
0.0000 |
| Purchases |
1.7750 |
1.7750 |
1.7750 |
1.7750 |
1.7750 |
1.7750 |
| Future Supplies |
0.4250 |
0.4250 |
0.4250 |
0.4250 |
0.4250 |
| Total Available Supply (MGD) |
1.7750 |
2.2000 |
2.2000 |
2.2000 |
2.2000 |
2.2000 |
| Service Area Demand |
0.5610 |
0.8172 |
0.8779 |
0.9387 |
0.9884 |
1.0381 |
| Sales |
0.0000 |
0.0000 |
0.0000 |
0.0000 |
0.0000 |
0.0000 |
| Future Sales |
0.0000 |
0.0000 |
0.0000 |
0.0000 |
0.0000 |
| Total Demand (MGD) |
0.5610 |
0.8172 |
0.8779 |
0.9387 |
0.9884 |
1.0381 |
| Demand as Percent of Supply |
32% |
37% |
40% |
43% |
45% |
47% |

The purpose of the above chart is to show a general indication of how the long-term per capita water demand changes over time. The per capita water demand may actually be different than indicated due to seasonal populations and the accuracy of data submitted. Water systems that have calculated long-term per capita water demand based on a methodology that produces different results may submit their information in the notes field.
Your long-term water demand is 48 gallons per capita per day. What demand management practices do you plan to implement to reduce the per capita water demand (i.e. conduct regular water audits, implement a plumbing retrofit program, employ practices such as rainwater harvesting or reclaimed water)? If these practices are covered elsewhere in your plan, indicate where the practices are discussed here.
We will continue to monitor our water usage. We are installing an AMI system this year. We are considering increasing our purchase agreement with PTRWA at the next plant expansion.
Are there other demand management practices you will implement to reduce your future supply needs? We are having our water and sewer systems studied to make sure we have adequate infrastructure to provide future water and sewer service to our jurisdiction.
What supplies other than the ones listed in future supplies are being considered to meet your future supply needs? We are considering agreements with the High Point and Greensboro water systems for future supplies, although the PTRWA water source appears to be adequate.
How does the water system intend to implement the demand management and supply planning components above? The Town has had our water and sewer system modelled by consultants, and we will update it periodically. We are conducting a rate study at this time.
We will use their findings and recommendations to maintain and improve our infrastructure. The Town will also be pursuing grant opportunities through state and federal programs.
Additional Information
Has this system participated in regional water supply or water use planning? Yes, We are a partner in the Piedmont Triad Regional Water Authority, and we address water needs and issues regionally.
What major water supply reports or studies were used for planning? We use previous LWSPs, water and sewer usage data, billing records, water and sewer mapping, county GIS information, and water and sewer modelling information.
Please describe any other needs or issues regarding your water supply sources, any water system deficiencies or needed improvements (storage, treatment, etc.) or your ability to meet present and future water needs. Include both quantity and quality considerations, as well as financial, technical, managerial, permitting, and compliance issues: We will be participating in treatment plant and infrastructure projects to address emerging compounds and the revised lead and copper requirements in the near future. We will be adding a water storage component to upcoming agreements.
The Division of Water Resources (DWR) provides the data contained within this
Local Water Supply Plan (LWSP) as a courtesy and service to our customers.
DWR staff does not field verify data. Neither DWR, nor any other party
involved in the preparation of this LWSP attests that the data is completely
free of errors and omissions. Furthermore, data users are cautioned that
LWSPs labeled PROVISIONAL have yet to be reviewed by DWR staff. Subsequent
review may result in significant revision. Questions regarding the accuracy
or limitations of usage of this data should be directed to the water system
and/or DWR.
|