|
The Division of Water Resources (DWR) provides the data contained within this
Local Water Supply Plan (LWSP) as a courtesy and service to our customers.
DWR staff does not field verify data. Neither DWR, nor any other party
involved in the preparation of this LWSP attests that the data is completely
free of errors and omissions. Furthermore, data users are cautioned that
LWSPs labeled PROVISIONAL have yet to be reviewed by DWR staff. Subsequent
review may result in significant revision. Questions regarding the accuracy
or limitations of usage of this data should be directed to the water system
and/or DWR.
1. System Information
Contact Information
Complete
| Water System Name: |
Eden |
|
PWSID: |
02-79-010 |
| Mailing Address: | 191 Mebane Bridge Road
Eden, NC 27288 | Ownership: | Municipality |
| |
| Contact Person: | Chris Powell | Title: | Water and Wastewater Superintendent |
| Phone: | 336-627-1009 | Cell/Mobile: | 336-430-2235 |
Distribution System
| Line Type |
Size Range (Inches) |
Estimated % of lines |
| Asbestos Cement |
1-8 |
10.45 % |
| Cast Iron |
6-14 |
19.69 % |
| Ductile Iron |
6-10 |
51.88 % |
| Galvanized Iron |
1-2 |
4.11 % |
| Other |
1-6 |
0.09 % |
| Polyvinyl Chloride |
4-36 |
13.78 % |
The negative number for the answer "How many feet of new lines were added during 2024?" comes from where we were able to kill out sections of 2" galvanized after other sections were replaced. Programs
Leak Detection equipment, leak correlators, are used to identify sources of water loss. Water Conservation
The City of Eden does not have an interconnection that could supply water back to the City's system. Wholesale to Dan River Water Inc. have an interconnection to Mayodan, NC such that in an emergency they may be able to lessen their demand on our resources. Eden is bounded by the Virginia State line to the North and the West, South and East by the Dan River for four miles or more. The county and the local municipalities have participated in meetings regarding interconnects, but funding due to the engineering feasibility studies have been limited and no progress has been made. 2. Water Use Information
Service Area
| Sub-Basin(s) | % of Service Population |
|---|
| Roanoke River (14-1) | 100 % |
|
| County(s) | % of Service Population |
|---|
| Rockingham | 100 % |
|
Water Use by Type
| Type of Use |
Metered
Connections |
Metered
Average Use (MGD) |
Non-Metered
Connections |
Non-Metered
Estimated Use (MGD) |
| Residential |
6,295 |
0.8093 |
0 |
0.0000 |
| Commercial |
554 |
0.1745 |
0 |
0.0000 |
| Industrial |
18 |
0.1537 |
0 |
0.0000 |
| Institutional |
127 |
0.0574 |
28 |
0.8000 |
How much water was used for system processes (backwash, line cleaning, flushing, etc.)? 0.7200 MGD
Some of the meters for the city facilities and parks were located and read. Other were estimated. This is included in the institutional. The high number of institutional connections are due to how the city finance department classifies connections. An example would be 7 connections for the high school (separate building, ball field, activity fields, etc.) The high use for the process water includes the washdown of storage tanks, basin cleaning, valve replacements at water plant and 24-hour automatic flushing units in the distribution system. The high non-metered estimate includes water running into railroad pump station because of the shut-down of industry in that area, and high volume of water main breaks during the cold months. Water Sales
| Purchaser |
PWSID |
Average
Daily Sold
(MGD) |
Days
Used |
Contract |
Required to
comply with water
use restrictions? |
Pipe Size(s)
(Inches) |
Use
Type |
| MGD |
Expiration |
Recurring |
| Dan River Water, Inc. |
02-79-040 |
1.1058 |
365 |
1.6670 |
2029 |
Yes |
Yes |
6-16 |
Regular |
3. Water Supply Sources
Monthly Withdrawals & Purchases
|
Average Daily
Use (MGD) |
Max Day
Use (MGD) |
|
Average Daily
Use (MGD) |
Max Day
Use (MGD) |
|
Average Daily
Use (MGD) |
Max Day
Use (MGD) |
| Jan |
4.1980 |
5.3980 |
May |
4.1160 |
4.7850 |
Sep |
4.6910 |
5.1040 |
| Feb |
4.1650 |
4.8050 |
Jun |
4.7040 |
5.4170 |
Oct |
4.6450 |
5.1950 |
| Mar |
3.9360 |
4.8650 |
Jul |
5.0320 |
6.1900 |
Nov |
4.4970 |
5.8160 |
| Apr |
3.8750 |
4.3550 |
Aug |
4.8230 |
6.3360 |
Dec |
4.1860 |
4.9780 |

Surface Water Sources
| Stream |
Reservoir |
Average Daily Withdrawal |
Maximum Day
Withdrawal (MGD) |
Available Raw
Water Supply |
Usable On-Stream
Raw Water Supply
Storage (MG) |
| MGD |
Days Used |
MGD |
* Qualifier |
| Dan River |
Raw Water Impoundment |
4.3600 |
365 |
5.0320 |
24.1700 |
F |
0.0000 |
* Qualifier: C=Contract Amount, SY20=20-year Safe Yield, SY50=50-year Safe Yield, F=20% of 7Q10 or other instream flow requirement, CUA=Capacity Use Area Permit
Surface Water Sources (continued)
| Stream |
Reservoir |
Drainage Area
(sq mi) |
Metered? |
Sub-Basin |
County |
Year
Offline |
Use
Type |
| Dan River |
Raw Water Impoundment |
1,150 |
Yes |
Roanoke River (14-1) |
Rockingham |
|
Regular |
Water Treatment Plants
| Plant Name |
Permitted Capacity
(MGD) |
Is Raw Water Metered? |
Is Finished Water Ouput Metered? |
Source |
| Eden WTP |
20.6000 |
Yes |
Yes |
Dan River |
4. Wastewater Information
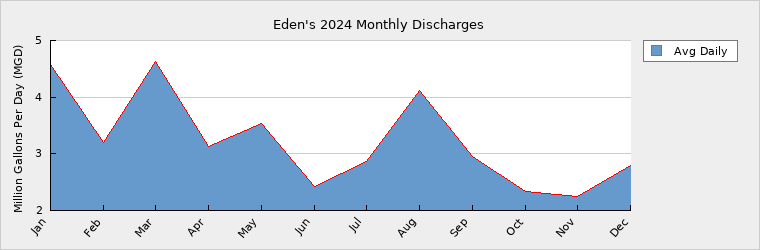
Monthly Discharges
|
Average Daily
Discharge (MGD) |
|
Average Daily
Discharge (MGD) |
|
Average Daily
Discharge (MGD) |
| Jan |
4.5700 |
May |
3.5310 |
Sep |
2.9600 |
| Feb |
3.1940 |
Jun |
2.4210 |
Oct |
2.3340 |
| Mar |
4.6240 |
Jul |
2.8650 |
Nov |
2.2440 |
| Apr |
3.1310 |
Aug |
4.1250 |
Dec |
2.7970 |
The City of Eden is in the process of converting from a mechanical aeration basin to a diffused air basin. We are also in the process of converting from feeding chlorine gas to feeding Sodium Hypochlorite. Both of these projects are in the beginning stages but hope to be completed well within the next ten years. Wastewater Permits
| Permit Number |
Type |
Permitted Capacity
(MGD) |
Design Capacity
(MGD) |
Average Annual
Daily Discharge
(MGD) |
Maximum Day Discharge
(MGD) |
Receiving Stream |
Receiving Basin |
| NC0025071 |
WWTP |
13.5000 |
13.5000 |
3.2330 |
14.3460 |
Dan River |
Roanoke River (14-1) |
Wastewater Interconnections
| Water System |
PWSID |
Type |
Average Daily Amount |
Contract
Maximum (MGD) |
| MGD |
Days Used |
| Rockingham County |
02-79-050 |
Receiving |
0.0547 |
365 |
0.2180 |
5. Planning
Projections
| |
2024 |
2030 |
2040 |
2050 |
2060 |
2070 |
| Year-Round Population |
15,332 |
15,300 |
15,200 |
15,100 |
15,000 |
14,900 |
| Seasonal Population |
0 |
0 |
0 |
0 |
0 |
0 |
| |
| Residential |
0.8093 |
0.8000 |
0.7900 |
0.7800 |
0.7700 |
0.7600 |
| Commercial |
0.1745 |
0.1700 |
0.1650 |
0.1600 |
0.1550 |
0.1500 |
| Industrial |
0.1537 |
0.1400 |
0.1450 |
0.1500 |
0.1550 |
0.1600 |
| Institutional |
0.8574 |
0.3400 |
0.3300 |
0.3200 |
0.3100 |
0.3000 |
| System Process |
0.7200 |
0.7200 |
0.7100 |
0.7000 |
0.6900 |
0.6800 |
| Unaccounted-for |
0.5304 |
0.4239 |
0.4181 |
0.4122 |
0.4064 |
0.4005 |
Demand v/s Percent of Supply
| |
2024 |
2030 |
2040 |
2050 |
2060 |
2070 |
| Surface Water Supply |
24.1700 |
24.1700 |
24.1700 |
24.1700 |
24.1700 |
24.1700 |
| Ground Water Supply |
0.0000 |
0.0000 |
0.0000 |
0.0000 |
0.0000 |
0.0000 |
| Purchases |
0.0000 |
0.0000 |
0.0000 |
0.0000 |
0.0000 |
0.0000 |
| Future Supplies |
0.0000 |
0.0000 |
0.0000 |
0.0000 |
0.0000 |
| Total Available Supply (MGD) |
24.1700 |
24.1700 |
24.1700 |
24.1700 |
24.1700 |
24.1700 |
| Service Area Demand |
3.2453 |
2.5939 |
2.5581 |
2.5222 |
2.4864 |
2.4505 |
| Sales |
1.1028 |
1.6670 |
1.6670 |
1.6670 |
1.6670 |
1.6670 |
| Future Sales |
0.0000 |
0.0000 |
0.0000 |
0.0000 |
0.0000 |
| Total Demand (MGD) |
4.3481 |
4.2609 |
4.2251 |
4.1892 |
4.1534 |
4.1175 |
| Demand as Percent of Supply |
18% |
18% |
17% |
17% |
17% |
17% |

The purpose of the above chart is to show a general indication of how the long-term per capita water demand changes over time. The per capita water demand may actually be different than indicated due to seasonal populations and the accuracy of data submitted. Water systems that have calculated long-term per capita water demand based on a methodology that produces different results may submit their information in the notes field.
Your long-term water demand is 53 gallons per capita per day. What demand management practices do you plan to implement to reduce the per capita water demand (i.e. conduct regular water audits, implement a plumbing retrofit program, employ practices such as rainwater harvesting or reclaimed water)? If these practices are covered elsewhere in your plan, indicate where the practices are discussed here.
No Changes
Are there other demand management practices you will implement to reduce your future supply needs?
What supplies other than the ones listed in future supplies are being considered to meet your future supply needs?
How does the water system intend to implement the demand management and supply planning components above?
Additional Information
Has this system participated in regional water supply or water use planning? Yes, The City of Eden Water System is participating in regional planning, working with Pittsylvania County and Danville, Virginia on a regional Mega Park in Virginia within 5 miles from the Eden City limits. The Mega Park is recruiting Industrial users for the 3500-acre site. Eden is to supply 6.5 MGD of water and treat up to 3 MGD of wastewater from the site.
What major water supply reports or studies were used for planning? Eden is currently working with a water demand of around 17% of capacity. Eden has lost industrial clients who closed their businesses over the last ten years that amount to 7.7MGD of water demand. Dewberry Engineering has been working with us on doing this project and planning any system changes that will be required for the Mega Park.
Please describe any other needs or issues regarding your water supply sources, any water system deficiencies or needed improvements (storage, treatment, etc.) or your ability to meet present and future water needs. Include both quantity and quality considerations, as well as financial, technical, managerial, permitting, and compliance issues: None at this time.
The Division of Water Resources (DWR) provides the data contained within this
Local Water Supply Plan (LWSP) as a courtesy and service to our customers.
DWR staff does not field verify data. Neither DWR, nor any other party
involved in the preparation of this LWSP attests that the data is completely
free of errors and omissions. Furthermore, data users are cautioned that
LWSPs labeled PROVISIONAL have yet to be reviewed by DWR staff. Subsequent
review may result in significant revision. Questions regarding the accuracy
or limitations of usage of this data should be directed to the water system
and/or DWR.
|