|
The Division of Water Resources (DWR) provides the data contained within this
Local Water Supply Plan (LWSP) as a courtesy and service to our customers.
DWR staff does not field verify data. Neither DWR, nor any other party
involved in the preparation of this LWSP attests that the data is completely
free of errors and omissions. Furthermore, data users are cautioned that
LWSPs labeled PROVISIONAL have yet to be reviewed by DWR staff. Subsequent
review may result in significant revision. Questions regarding the accuracy
or limitations of usage of this data should be directed to the water system
and/or DWR.
1. System Information
Contact Information
Provisional
| Water System Name: |
Elkin |
|
PWSID: |
02-86-020 |
| Mailing Address: | P.O. Box 857
Elkin, NC 28621 | Ownership: | Municipality |
| |
| Contact Person: | Travis Butcher | Title: | Public Works Utilities Director |
| Phone: | 336-258-8915 | Cell/Mobile: | -- |
| |
| Secondary Contact: | Michelle Wood | | Phone: | 336-258-8915 |
| Mailing Address: | P.O. Box 857
Elkin, NC 28621 | Cell/Mobile: | -- |
Distribution System
| Line Type |
Size Range (Inches) |
Estimated % of lines |
| Asbestos Cement |
4-16 |
31.00 % |
| Cast Iron |
6-16 |
16.00 % |
| Ductile Iron |
6-12 |
5.00 % |
| Galvanized Iron |
3/4-2 |
3.00 % |
| Other |
3/4-2 |
5.00 % |
| Polyvinyl Chloride |
2-12 |
40.00 % |
The Town of Elkin continues to remove lead goosenecks and replace old galvanized service lines with plastic pipe. Programs
The Town of Elkin uses listening devices along with data loggers to locate leaks in the system. The town also uses information from the Yadkin Valley Sewer Authority. When YVSA cameras a sewer line they may discover a water leak that's getting into the sewer system and not surfacing. We continue to replace lead and galvanized services every year. we also enlist the help of the NCRWA if needed. Water Conservation
The Town of Elkin has an interconnection with the Town of Jonesville. They can supply Elkin with 750 GPM in an emergency. 2. Water Use Information
Service Area
| Sub-Basin(s) | % of Service Population |
|---|
| Yadkin River (18-1) | 100 % |
|
| County(s) | % of Service Population |
|---|
| Surry | 93 % |
| Wilkes | 7 % |
|
Population is from North Carolina Office of State Budget and Management. Water Use by Type
| Type of Use |
Metered
Connections |
Metered
Average Use (MGD) |
Non-Metered
Connections |
Non-Metered
Estimated Use (MGD) |
| Residential |
1,585 |
0.2011 |
0 |
0.0000 |
| Commercial |
422 |
0.1735 |
60 |
0.0090 |
| Industrial |
8 |
0.2469 |
13 |
0.0120 |
| Institutional |
53 |
0.0902 |
8 |
0.0000 |
How much water was used for system processes (backwash, line cleaning, flushing, etc.)? 0.0550 MGD
Non metered connections include all buildings that have fire sprinkler systems. 375 fire hydrants in town of Elkin. Water Sales
| Purchaser |
PWSID |
Average
Daily Sold
(MGD) |
Days
Used |
Contract |
Required to
comply with water
use restrictions? |
Pipe Size(s)
(Inches) |
Use
Type |
| MGD |
Expiration |
Recurring |
| Town of Jonesville |
02-99-010 |
0.0000 |
0 |
0.0000 |
2047 |
No |
Yes |
8 |
Emergency |
| Town of Ronda |
01-97-050 |
0.0452 |
365 |
0.0500 |
2050 |
Yes |
Yes |
8 |
Regular |
3. Water Supply Sources
Monthly Withdrawals & Purchases
|
Average Daily
Use (MGD) |
Max Day
Use (MGD) |
|
Average Daily
Use (MGD) |
Max Day
Use (MGD) |
|
Average Daily
Use (MGD) |
Max Day
Use (MGD) |
| Jan |
0.9680 |
1.3290 |
May |
0.9860 |
1.1870 |
Sep |
1.0090 |
1.2110 |
| Feb |
0.9580 |
1.2880 |
Jun |
1.0480 |
1.1870 |
Oct |
0.9480 |
1.3600 |
| Mar |
0.9680 |
1.2090 |
Jul |
1.0370 |
1.3270 |
Nov |
0.9650 |
1.1900 |
| Apr |
1.0130 |
1.3890 |
Aug |
1.0250 |
1.1810 |
Dec |
0.9010 |
1.2640 |

Surface Water Sources
| Stream |
Reservoir |
Average Daily Withdrawal |
Maximum Day
Withdrawal (MGD) |
Available Raw
Water Supply |
Usable On-Stream
Raw Water Supply
Storage (MG) |
| MGD |
Days Used |
MGD |
* Qualifier |
| Elkin Creek |
Elkin |
0.9493 |
365 |
0.0000 |
5.8000 |
SY20 |
0.0000 |
| Yadkin River |
Elkin |
0.0000 |
0 |
0.0000 |
40.8000 |
F |
0.0000 |
* Qualifier: C=Contract Amount, SY20=20-year Safe Yield, SY50=50-year Safe Yield, F=20% of 7Q10 or other instream flow requirement, CUA=Capacity Use Area Permit
Surface Water Sources (continued)
| Stream |
Reservoir |
Drainage Area
(sq mi) |
Metered? |
Sub-Basin |
County |
Year
Offline |
Use
Type |
| Elkin Creek |
Elkin |
34 |
No |
Yadkin River (18-1) |
Surry |
|
Regular |
| Yadkin River |
Elkin |
833 |
No |
Yadkin River (18-1) |
Surry |
|
Emergency |
There are no meters in place to measure water pumped from creek to reservoir, it is estimated based on daily water usage.
The annual average daily water usage is determined by the meter at the WTP that records flow from the reservoir.
Water Purchases From Other Systems
| Seller |
PWSID |
Average
Daily Purchased
(MGD) |
Days
Used |
Contract |
Required to
comply with water
use restrictions? |
Pipe Size(s)
(Inches) |
Use
Type |
| MGD |
Expiration |
Recurring |
| Town of Jonesville |
02-99-010 |
0.0000 |
0 |
0.0000 |
2047 |
No |
Yes |
8. |
Emergency |
Water Treatment Plants
| Plant Name |
Permitted Capacity
(MGD) |
Is Raw Water Metered? |
Is Finished Water Ouput Metered? |
Source |
| Elkin MUNICIPAL WTP |
3.0000 |
Yes |
Yes |
ELKIN CREEK |
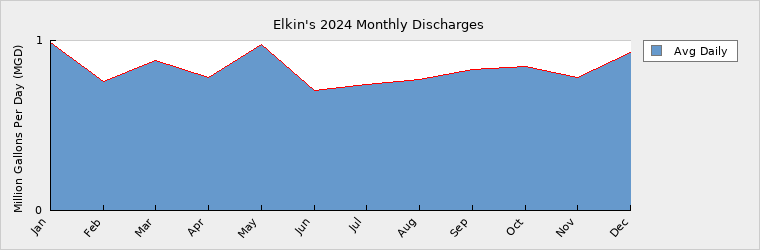
4. Wastewater Information
Monthly Discharges
|
Average Daily
Discharge (MGD) |
|
Average Daily
Discharge (MGD) |
|
Average Daily
Discharge (MGD) |
| Jan |
0.9870 |
May |
0.9740 |
Sep |
0.8290 |
| Feb |
0.7560 |
Jun |
0.7060 |
Oct |
0.8460 |
| Mar |
0.8850 |
Jul |
0.7390 |
Nov |
0.7820 |
| Apr |
0.7830 |
Aug |
0.7730 |
Dec |
0.9310 |
he Town of Elkin does not look after the sewer. For any information on future expansion or any questions pertaining to wastewater, contact the Yadkin Valley Sewer Authority: (336) 835-9819. Wastewater Interconnections
| Water System |
PWSID |
Type |
Average Daily Amount |
Contract
Maximum (MGD) |
| MGD |
Days Used |
| Yadkin Valley Sewer Authority |
00-00-000 |
Discharging |
0.8340 |
365 |
1.8000 |
| Jonesville |
02-99-010 |
Receiving |
0.1710 |
365 |
|
| Ronda |
01-97-050 |
Receiving |
0.0240 |
365 |
|
Yadkin Valley Sewer Authority collects wastewater from Elkin, Jonesville, and Ronda. There are no metering devices in place to measure wastewater flow. Billing information from each town is used to provide this information.
Since wastewater from Jonesville and Ronda is collected by the Yadkin Valley Sewer Authority, those wastewater flows have been removed from this plan 5. Planning
Projections
| |
2024 |
2030 |
2040 |
2050 |
2060 |
2070 |
| Year-Round Population |
4,076 |
4,150 |
4,480 |
4,600 |
4,840 |
5,020 |
| Seasonal Population |
0 |
0 |
0 |
0 |
0 |
0 |
| |
| Residential |
0.2011 |
0.2400 |
0.2445 |
0.2450 |
0.2460 |
0.2470 |
| Commercial |
0.1825 |
0.2740 |
0.2750 |
0.2760 |
0.2770 |
0.2780 |
| Industrial |
0.2589 |
0.3375 |
0.3395 |
0.3405 |
0.3420 |
0.3435 |
| Institutional |
0.0902 |
0.0990 |
0.0995 |
0.1000 |
0.1005 |
0.1010 |
| System Process |
0.0550 |
0.0900 |
0.0900 |
0.0900 |
0.0900 |
0.0900 |
| Unaccounted-for |
0.1139 |
0.2233 |
0.2250 |
0.2256 |
0.2264 |
0.2272 |
Demand v/s Percent of Supply
| |
2024 |
2030 |
2040 |
2050 |
2060 |
2070 |
| Surface Water Supply |
5.8000 |
5.8000 |
5.8000 |
5.8000 |
5.8000 |
5.8000 |
| Ground Water Supply |
0.0000 |
0.0000 |
0.0000 |
0.0000 |
0.0000 |
0.0000 |
| Purchases |
0.0000 |
0.0000 |
0.0000 |
0.0000 |
0.0000 |
0.0000 |
| Future Supplies |
0.0000 |
0.0000 |
0.0000 |
0.0000 |
0.0000 |
| Total Available Supply (MGD) |
5.8000 |
5.8000 |
5.8000 |
5.8000 |
5.8000 |
5.8000 |
| Service Area Demand |
0.9016 |
1.2638 |
1.2735 |
1.2771 |
1.2819 |
1.2867 |
| Sales |
0.0451 |
0.0500 |
0.0500 |
0.0500 |
0.0500 |
0.0500 |
| Future Sales |
0.0000 |
0.0000 |
0.0000 |
0.0000 |
0.0000 |
| Total Demand (MGD) |
0.9467 |
1.3138 |
1.3235 |
1.3271 |
1.3319 |
1.3367 |
| Demand as Percent of Supply |
16% |
23% |
23% |
23% |
23% |
23% |

The purpose of the above chart is to show a general indication of how the long-term per capita water demand changes over time. The per capita water demand may actually be different than indicated due to seasonal populations and the accuracy of data submitted. Water systems that have calculated long-term per capita water demand based on a methodology that produces different results may submit their information in the notes field.
Your long-term water demand is 49 gallons per capita per day. What demand management practices do you plan to implement to reduce the per capita water demand (i.e. conduct regular water audits, implement a plumbing retrofit program, employ practices such as rainwater harvesting or reclaimed water)? If these practices are covered elsewhere in your plan, indicate where the practices are discussed here.
No Changes
Are there other demand management practices you will implement to reduce your future supply needs?
What supplies other than the ones listed in future supplies are being considered to meet your future supply needs?
How does the water system intend to implement the demand management and supply planning components above?
Additional Information
Has this system participated in regional water supply or water use planning? No
What major water supply reports or studies were used for planning?
Please describe any other needs or issues regarding your water supply sources, any water system deficiencies or needed improvements (storage, treatment, etc.) or your ability to meet present and future water needs. Include both quantity and quality considerations, as well as financial, technical, managerial, permitting, and compliance issues:
The Division of Water Resources (DWR) provides the data contained within this
Local Water Supply Plan (LWSP) as a courtesy and service to our customers.
DWR staff does not field verify data. Neither DWR, nor any other party
involved in the preparation of this LWSP attests that the data is completely
free of errors and omissions. Furthermore, data users are cautioned that
LWSPs labeled PROVISIONAL have yet to be reviewed by DWR staff. Subsequent
review may result in significant revision. Questions regarding the accuracy
or limitations of usage of this data should be directed to the water system
and/or DWR.
|