|
The Division of Water Resources (DWR) provides the data contained within this
Local Water Supply Plan (LWSP) as a courtesy and service to our customers.
DWR staff does not field verify data. Neither DWR, nor any other party
involved in the preparation of this LWSP attests that the data is completely
free of errors and omissions. Furthermore, data users are cautioned that
LWSPs labeled PROVISIONAL have yet to be reviewed by DWR staff. Subsequent
review may result in significant revision. Questions regarding the accuracy
or limitations of usage of this data should be directed to the water system
and/or DWR.
1. System Information
Contact Information
Complete
| Water System Name: |
Kerr Lake RWS |
|
PWSID: |
02-91-999 |
| Mailing Address: | PO Box 1434
Henderson, NC 27536 | Ownership: | Municipality |
| |
| Contact Person: | Christy Lipscomb | Title: | ORC |
| Phone: | 252-438-2141 | Cell/Mobile: | |
Distribution System
| Line Type |
Size Range (Inches) |
Estimated % of lines |
| Asbestos Cement |
24 |
14.00 % |
| Ductile Iron |
16-30 |
79.00 % |
| Other |
36 |
7.00 % |
1) asbestos cement = 13.7%, other = 7.3%
2) Other is comprised of concrete lined cylinder pipe. Second mains to Oxford and Warren County have been added. Programs
Water Conservation
2. Water Use Information
Service Area
| Sub-Basin(s) | % of Service Population |
|---|
| Roanoke River (14-1) | 0 % |
| Tar River (15-1) | 0 % |
| Fishing Creek (15-2) | 0 % |
|
| County(s) | % of Service Population |
|---|
| Vance | 0 % |
| Granville | 0 % |
| Warren | 0 % |
|
Water Use by Type
| Type of Use |
Metered
Connections |
Metered
Average Use (MGD) |
Non-Metered
Connections |
Non-Metered
Estimated Use (MGD) |
| Residential |
0 |
0.0000 |
0 |
0.0000 |
| Commercial |
0 |
0.0000 |
0 |
0.0000 |
| Industrial |
0 |
0.0000 |
0 |
0.0000 |
| Institutional |
0 |
0.0000 |
0 |
0.0000 |
How much water was used for system processes (backwash, line cleaning, flushing, etc.)? 0.3060 MGD
1) Kerr Lake sells water only to Warren County, the City of Henderson and the City of Oxford. Residential & other types of water users are not reported here but instead in the LWSP for the individual Cities, Towns & County users. Otherwise the water user information would be counted twice in the overall basin analysis.
2) The amount raw water withdrawn has now been estimated to be 6.455 mgd [2-D (8). This is based on 5.776 mgd sold, 0.306 mgd of plant process water and 5.78% of unaccountable water. The 1997 percentage rate for unaccountable water has been used since accurate data is not available for 2002 due to a faulty raw water meter. The meter was repaired and calibrated in October 2004 and now appears to be reporting values that appear to be accurate. This implies that the raw water data from 2002, while not accurate was precise in that Kerr lake RWS bases its sales on the reported values.
3) The process water is the average amount that was actually discharged from the alum sludge facilities to Anderson Creek and includes backwashing and the sludge removal by way of the automated sludge removal system. Water Sales
| Purchaser |
PWSID |
Average
Daily Sold
(MGD) |
Days
Used |
Contract |
Required to
comply with water
use restrictions? |
Pipe Size(s)
(Inches) |
Use
Type |
| MGD |
Expiration |
Recurring |
| Henderson |
02-91-010 |
3.4940 |
365 |
6.0000 |
2037 |
|
|
24,30 |
Regular |
| Oxford |
02-39-010 |
1.3850 |
365 |
2.0000 |
2037 |
|
|
24 |
Regular |
| Warren Co |
02-93-015 |
0.9090 |
365 |
2.0000 |
2037 |
|
|
20 |
Regular |
Water sales are only to three (3) bulk users. 3. Water Supply Sources
Monthly Withdrawals & Purchases
|
Average Daily
Use (MGD) |
Max Day
Use (MGD) |
|
Average Daily
Use (MGD) |
Max Day
Use (MGD) |
|
Average Daily
Use (MGD) |
Max Day
Use (MGD) |
| Jan |
5.9640 |
7.3370 |
May |
6.8100 |
9.2430 |
Sep |
6.6540 |
7.7590 |
| Feb |
6.0160 |
6.7050 |
Jun |
7.6060 |
9.0890 |
Oct |
6.0030 |
7.4500 |
| Mar |
5.8170 |
6.6650 |
Jul |
6.6950 |
7.8470 |
Nov |
5.8550 |
6.6360 |
| Apr |
6.3120 |
8.0470 |
Aug |
7.1810 |
8.4800 |
Dec |
6.5480 |
7.8580 |
The above submitted values are based on the estimated value for the total water used (average daily use=6.455 mgd). The daily values have been increased by 11%, which is the approximate percentage that the raw water meter was misreading. 
Surface Water Sources
| Stream |
Reservoir |
Average Daily Withdrawal |
Maximum Day
Withdrawal (MGD) |
Available Raw
Water Supply |
Usable On-Stream
Raw Water Supply
Storage (MG) |
| MGD |
Days Used |
MGD |
* Qualifier |
| Roanoke River |
Kerr Lake |
6.4550 |
365 |
9.2430 |
10.0000 |
C |
20.0000 |
* Qualifier: C=Contract Amount, SY20=20-year Safe Yield, SY50=50-year Safe Yield, F=20% of 7Q10 or other instream flow requirement, CUA=Capacity Use Area Permit
Surface Water Sources (continued)
| Stream |
Reservoir |
Drainage Area
(sq mi) |
Metered? |
Sub-Basin |
County |
Year
Offline |
Use
Type |
| Roanoke River |
Kerr Lake |
7,780 |
Yes |
Roanoke River (14-1) |
Vance |
|
Regular |
The above submitted values are based on the estimated value for the total water used (average daily use = 6.455 mgd). The daily values have been increased by 11%, which is the approximate percentage that the raw water meter was misreading. Water Treatment Plants
| Plant Name |
Permitted Capacity
(MGD) |
Is Raw Water Metered? |
Is Finished Water Ouput Metered? |
Source |
| Kerr Lake Regional WTP |
13.9700 |
Yes |
Yes |
Kerr Lake |
Design is underway to expand the plant capacity to 20 MGD. 4. Wastewater Information
Monthly Discharges
|
Average Daily
Discharge (MGD) |
|
Average Daily
Discharge (MGD) |
|
Average Daily
Discharge (MGD) |
| Jan |
0.0710 |
May |
0.2890 |
Sep |
0.2940 |
| Feb |
0.2750 |
Jun |
0.4390 |
Oct |
0.3210 |
| Mar |
0.3730 |
Jul |
0.3810 |
Nov |
0.2180 |
| Apr |
0.3450 |
Aug |
0.3590 |
Dec |
0.3130 |
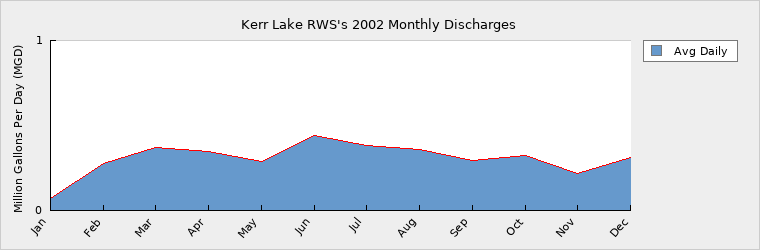
Discharge is supernatant from the alum sludge thickeners. Wastewater Permits
| Permit Number |
Type |
Permitted Capacity
(MGD) |
Design Capacity
(MGD) |
Average Annual
Daily Discharge
(MGD) |
Maximum Day Discharge
(MGD) |
Receiving Stream |
Receiving Basin |
| NC0083101 |
|
0.0000 |
0.0000 |
0.3060 |
1.3390 |
Anderson Swamp Creek |
Roanoke River (14-1) |
1) This discharge is from the alum sludge thickeners. 2) Permitted and design capacity is unlimited. 5. Planning
Projections
| |
2002 |
2010 |
2020 |
2030 |
| Year-Round Population |
0 |
0 |
0 |
0 |
| Seasonal Population |
0 |
0 |
0 |
0 |
| |
| Residential |
0.0000 |
0.0000 |
0.0000 |
0.0000 |
| Commercial |
0.0000 |
0.0000 |
0.0000 |
0.0000 |
| Industrial |
0.0000 |
0.0000 |
0.0000 |
0.0000 |
| Institutional |
0.0000 |
0.0000 |
0.0000 |
0.0000 |
| System Process |
0.3060 |
0.5290 |
0.8240 |
1.0880 |
| Unaccounted-for |
0.3610 |
0.3610 |
0.3610 |
0.3610 |
Kerr Lake RWS only has three (3) bulk users.1) The process water is the average amount that was actually discharged from the alum sludge facilities to Anderson Creek and includes backwashing and the sludge removal by way of the automated sludge removal system.
2) Projected average daily service area demand was updated after the faulty meter was located and recalibrated.
3) The unaccounted-for water was assumed to be 5.78% (1997 LWSP) since the faulty raw water meter made an accurate determination impossible.
4) Kerr Lake RWS is currently petitioning to obtain an Interbasin Transfer certification for additional withdrawal to supply its 3 bulk users' future demand. Future Water Sales
| Purchaser |
PWSID |
Contract |
Pipe Size(s) (Inches) |
Use Type |
| MGD |
Year Begin |
Year End |
| Oxford |
02-39-010 |
2.0000 |
|
|
|
Regular |
Demand v/s Percent of Supply
| |
2002 |
2010 |
2020 |
2030 |
| Surface Water Supply |
10.0000 |
10.0000 |
10.0000 |
10.0000 |
| Ground Water Supply |
0.0000 |
0.0000 |
0.0000 |
0.0000 |
| Purchases |
0.0000 |
0.0000 |
0.0000 |
0.0000 |
| Future Supplies |
0.0000 |
0.0000 |
0.0000 |
| Total Available Supply (MGD) |
10.0000 |
10.0000 |
10.0000 |
10.0000 |
| Service Area Demand |
0.6670 |
0.8900 |
1.1850 |
1.4490 |
| Sales |
5.7880 |
10.0000 |
10.0000 |
10.0000 |
| Future Sales |
2.0000 |
2.0000 |
2.0000 |
| Total Demand (MGD) |
6.4550 |
12.8900 |
13.1850 |
13.4490 |
| Demand as Percent of Supply |
65% |
129% |
132% |
134% |

The purpose of the above chart is to show a general indication of how the long-term per capita water demand changes over time. The per capita water demand may actually be different than indicated due to seasonal populations and the accuracy of data submitted. Water systems that have calculated long-term per capita water demand based on a methodology that produces different results may submit their information in the notes field.
Your long-term water demand is unavailable until we receive population data for 2002 gallons per capita per day. What demand management practices do you plan to implement to reduce the per capita water demand (i.e. conduct regular water audits, implement a plumbing retrofit program, employ practices such as rainwater harvesting or reclaimed water)? If these practices are covered elsewhere in your plan, indicate where the practices are discussed here.
Are there other demand management practices you will implement to reduce your future supply needs?
What supplies other than the ones listed in future supplies are being considered to meet your future supply needs?
How does the water system intend to implement the demand management and supply planning components above?
1) Design is approximately 90% complete for an expansion of the water treatment plant capacity to 20.0 MGD. Construction is expected to begin by the end of 2003.
2) Kerr Lake RWS is currently petitioning to obtain an Interbasin Transfer certification for additional withdrawal to supply its 3 bulk users' future demand. Additional Information
Has this system participated in regional water supply or water use planning? Yes
What major water supply reports or studies were used for planning? The Water Master Plan, Phase II, dated March 1999.
Please describe any other needs or issues regarding your water supply sources, any water system deficiencies or needed improvements (storage, treatment, etc.) or your ability to meet present and future water needs. Include both quantity and quality considerations, as well as financial, technical, managerial, permitting, and compliance issues: 1. New 10 and 15 MGD Raw Water Pumps with VFDs and Meter Vault. 2. A 24 inch parallel Raw Water Main. 3. Back-up Filter Backwash System. 4. New 15 MGD Finish Water Pump. 5. New stand-by Generator and Electrical Switchgear. 6. Clearwell roof Repairs. 7. New Chemical Feed and Storage Facilities. 8. New Flash Mix and Flocculation Equipment and Improvements.
The Division of Water Resources (DWR) provides the data contained within this
Local Water Supply Plan (LWSP) as a courtesy and service to our customers.
DWR staff does not field verify data. Neither DWR, nor any other party
involved in the preparation of this LWSP attests that the data is completely
free of errors and omissions. Furthermore, data users are cautioned that
LWSPs labeled PROVISIONAL have yet to be reviewed by DWR staff. Subsequent
review may result in significant revision. Questions regarding the accuracy
or limitations of usage of this data should be directed to the water system
and/or DWR.
|