|
The Division of Water Resources (DWR) provides the data contained within this
Local Water Supply Plan (LWSP) as a courtesy and service to our customers.
DWR staff does not field verify data. Neither DWR, nor any other party
involved in the preparation of this LWSP attests that the data is completely
free of errors and omissions. Furthermore, data users are cautioned that
LWSPs labeled PROVISIONAL have yet to be reviewed by DWR staff. Subsequent
review may result in significant revision. Questions regarding the accuracy
or limitations of usage of this data should be directed to the water system
and/or DWR.
1. System Information
Contact Information
Complete
| Water System Name: |
Siler City |
|
PWSID: |
03-19-010 |
| Mailing Address: | PO. Box 769
Siler City, NC 27344 | Ownership: | Municipality |
| |
| Contact Person: | Chris McCorquodale | Title: | Public Utilities Director |
| Phone: | 919-726-8614 | Cell/Mobile: | 336-301-2786 |
| |
| Secondary Contact: | Jack Meadows, Town Manager | | Phone: | 919-742-2323 |
| Mailing Address: | PO. Box 769
Siler City, NC 27344 | Cell/Mobile: | 336-301-2786 |
Distribution System
| Line Type |
Size Range (Inches) |
Estimated % of lines |
| Asbestos Cement |
6-12 |
20.00 % |
| Cast Iron |
4-16 |
12.00 % |
| Ductile Iron |
4-16 |
15.00 % |
| Galvanized Iron |
2 |
8.00 % |
| Polyvinyl Chloride |
2-12 |
45.00 % |
We are in the process of replacing all 2" and below water meters over to AMI, smart meters. This project should finish up this year. Programs
The Town is in the process of replacing all 2" and below meters with smart meters. Water Conservation
2. Water Use Information
Service Area
| Sub-Basin(s) | % of Service Population |
|---|
| Deep River (02-2) | 100 % |
|
| County(s) | % of Service Population |
|---|
| Chatham | 100 % |
|
The current map on file is the best we have at this time. We are working with TriRiver on creating a system service area map. Water Use by Type
| Type of Use |
Metered
Connections |
Metered
Average Use (MGD) |
Non-Metered
Connections |
Non-Metered
Estimated Use (MGD) |
| Residential |
3,478 |
0.4830 |
0 |
0.0000 |
| Commercial |
422 |
0.2451 |
0 |
0.0000 |
| Industrial |
13 |
0.0896 |
0 |
0.0000 |
| Institutional |
61 |
0.9680 |
0 |
0.0000 |
How much water was used for system processes (backwash, line cleaning, flushing, etc.)? 0.2650 MGD
Water Sales
| Purchaser |
PWSID |
Average
Daily Sold
(MGD) |
Days
Used |
Contract |
Required to
comply with water
use restrictions? |
Pipe Size(s)
(Inches) |
Use
Type |
| MGD |
Expiration |
Recurring |
| Chatham County |
03-19-050 |
0.0596 |
365 |
0.0700 |
2029 |
Yes |
Yes |
8&12 |
Regular |
3. Water Supply Sources
Monthly Withdrawals & Purchases
|
Average Daily
Use (MGD) |
Max Day
Use (MGD) |
|
Average Daily
Use (MGD) |
Max Day
Use (MGD) |
|
Average Daily
Use (MGD) |
Max Day
Use (MGD) |
| Jan |
2.4900 |
|
May |
2.1900 |
|
Sep |
2.2700 |
|
| Feb |
3.0700 |
|
Jun |
2.2300 |
|
Oct |
2.3200 |
|
| Mar |
2.3800 |
|
Jul |
2.4100 |
|
Nov |
2.2400 |
|
| Apr |
2.2300 |
|
Aug |
2.3300 |
|
Dec |
2.8500 |
|

Surface Water Sources
| Stream |
Reservoir |
Average Daily Withdrawal |
Maximum Day
Withdrawal (MGD) |
Available Raw
Water Supply |
Usable On-Stream
Raw Water Supply
Storage (MG) |
| MGD |
Days Used |
MGD |
* Qualifier |
| Rocky River |
Upper and Lower |
2.4100 |
365 |
0.0000 |
4.0000 |
SY20 |
440.0000 |
* Qualifier: C=Contract Amount, SY20=20-year Safe Yield, SY50=50-year Safe Yield, F=20% of 7Q10 or other instream flow requirement, CUA=Capacity Use Area Permit
Surface Water Sources (continued)
| Stream |
Reservoir |
Drainage Area
(sq mi) |
Metered? |
Sub-Basin |
County |
Year
Offline |
Use
Type |
| Rocky River |
Upper and Lower |
92 |
Yes |
Deep River (02-2) |
Chatham |
|
Regular |
Minimum release is required by permit. Data is available for view at water plant or townhall. Water Purchases From Other Systems
| Seller |
PWSID |
Average
Daily Purchased
(MGD) |
Days
Used |
Contract |
Required to
comply with water
use restrictions? |
Pipe Size(s)
(Inches) |
Use
Type |
| MGD |
Expiration |
Recurring |
| South Chatham Water System |
03-19-050 |
0.0192 |
365 |
1.0000 |
2029 |
Yes |
Yes |
12 |
Regular |
Water Treatment Plants
| Plant Name |
Permitted Capacity
(MGD) |
Is Raw Water Metered? |
Is Finished Water Ouput Metered? |
Source |
| Siler City Water Treatment Pla |
4.0000 |
Yes |
Yes |
Rocky River |
4. Wastewater Information
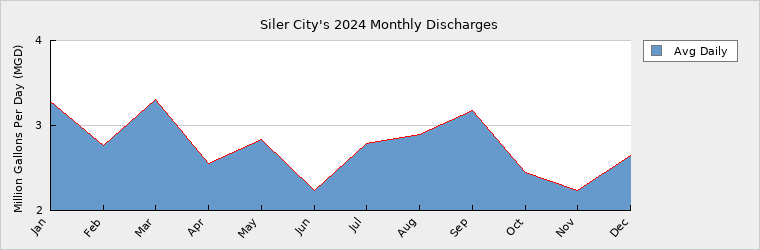
Monthly Discharges
|
Average Daily
Discharge (MGD) |
|
Average Daily
Discharge (MGD) |
|
Average Daily
Discharge (MGD) |
| Jan |
3.2800 |
May |
2.8300 |
Sep |
3.1800 |
| Feb |
2.7600 |
Jun |
2.2400 |
Oct |
2.4500 |
| Mar |
3.3000 |
Jul |
2.7900 |
Nov |
2.2400 |
| Apr |
2.5500 |
Aug |
2.8900 |
Dec |
2.6500 |
Wastewater plant is under construction now to go from 4 MGD to 6 MGD. Wastewater Permits
| Permit Number |
Type |
Permitted Capacity
(MGD) |
Design Capacity
(MGD) |
Average Annual
Daily Discharge
(MGD) |
Maximum Day Discharge
(MGD) |
Receiving Stream |
Receiving Basin |
| NC0026441 |
WWTP |
4.0000 |
4.0000 |
2.7600 |
7.9000 |
Loves Creek |
Deep River (02-2) |
5. Planning
Projections
| |
2024 |
2030 |
2040 |
2050 |
2060 |
2070 |
| Year-Round Population |
8,520 |
8,827 |
10,655 |
12,622 |
14,952 |
17,712 |
| Seasonal Population |
0 |
0 |
0 |
0 |
0 |
0 |
| |
| Residential |
0.4830 |
0.4591 |
0.5542 |
0.6565 |
0.7777 |
0.9212 |
| Commercial |
0.2451 |
0.2602 |
0.3017 |
0.3053 |
0.3282 |
0.4019 |
| Industrial |
0.0896 |
1.0037 |
1.0238 |
1.0441 |
1.0646 |
1.0854 |
| Institutional |
0.9680 |
1.1150 |
1.1351 |
1.2538 |
1.4409 |
1.5299 |
| System Process |
0.2650 |
0.5002 |
0.4997 |
0.4992 |
0.4699 |
0.5390 |
| Unaccounted-for |
0.3125 |
0.2889 |
0.3104 |
0.3361 |
0.3640 |
0.3923 |
Siler City plans to upgrade the water plant from 4MGD to 6MGD in the near future. Also, interconnection between Asheboro and Siler City should come online in the next year to help Siler City supply water to the CAM Site. Future Supply Sources
| Source Name |
PWSID |
Source Type |
Additional Supply |
Year Online |
Year Offline |
Type |
| City of Asheboro |
02-76-010 |
Purchase |
2.0000 |
2030 |
|
Regular |
Demand v/s Percent of Supply
| |
2024 |
2030 |
2040 |
2050 |
2060 |
2070 |
| Surface Water Supply |
4.0000 |
4.0000 |
4.0000 |
4.0000 |
4.0000 |
4.0000 |
| Ground Water Supply |
0.0000 |
0.0000 |
0.0000 |
0.0000 |
0.0000 |
0.0000 |
| Purchases |
1.0000 |
1.0000 |
1.0000 |
1.0000 |
1.0000 |
1.0000 |
| Future Supplies |
2.0000 |
2.0000 |
2.0000 |
2.0000 |
2.0000 |
| Total Available Supply (MGD) |
5.0000 |
7.0000 |
7.0000 |
7.0000 |
7.0000 |
7.0000 |
| Service Area Demand |
2.3632 |
3.6271 |
3.8249 |
4.0950 |
4.4453 |
4.8697 |
| Sales |
0.0594 |
0.0700 |
0.0700 |
0.0700 |
0.0700 |
0.0700 |
| Future Sales |
0.0000 |
0.0000 |
0.0000 |
0.0000 |
0.0000 |
| Total Demand (MGD) |
2.4226 |
3.6971 |
3.8949 |
4.1650 |
4.5153 |
4.9397 |
| Demand as Percent of Supply |
48% |
53% |
56% |
60% |
65% |
71% |

The purpose of the above chart is to show a general indication of how the long-term per capita water demand changes over time. The per capita water demand may actually be different than indicated due to seasonal populations and the accuracy of data submitted. Water systems that have calculated long-term per capita water demand based on a methodology that produces different results may submit their information in the notes field.
Your long-term water demand is 57 gallons per capita per day. What demand management practices do you plan to implement to reduce the per capita water demand (i.e. conduct regular water audits, implement a plumbing retrofit program, employ practices such as rainwater harvesting or reclaimed water)? If these practices are covered elsewhere in your plan, indicate where the practices are discussed here.
No changes
Are there other demand management practices you will implement to reduce your future supply needs? We are looking at options to purchase water outside of Siler City. We are also in the process of updating our UDO, to include requiring water saving devices in all new construction.
What supplies other than the ones listed in future supplies are being considered to meet your future supply needs? The town is lookingto expand the water plant in the next few years.
How does the water system intend to implement the demand management and supply planning components above? The Town is in the process of changing over to AMI smart meters to, give us better accuracy in our water consumption
Additional Information
Has this system participated in regional water supply or water use planning? No
What major water supply reports or studies were used for planning?
Please describe any other needs or issues regarding your water supply sources, any water system deficiencies or needed improvements (storage, treatment, etc.) or your ability to meet present and future water needs. Include both quantity and quality considerations, as well as financial, technical, managerial, permitting, and compliance issues: Siler City is looking to build a 5000,000-gallon water tank on the CAM Site property to serve the CAM Site.
The Division of Water Resources (DWR) provides the data contained within this
Local Water Supply Plan (LWSP) as a courtesy and service to our customers.
DWR staff does not field verify data. Neither DWR, nor any other party
involved in the preparation of this LWSP attests that the data is completely
free of errors and omissions. Furthermore, data users are cautioned that
LWSPs labeled PROVISIONAL have yet to be reviewed by DWR staff. Subsequent
review may result in significant revision. Questions regarding the accuracy
or limitations of usage of this data should be directed to the water system
and/or DWR.
|