|
The Division of Water Resources (DWR) provides the data contained within this
Local Water Supply Plan (LWSP) as a courtesy and service to our customers.
DWR staff does not field verify data. Neither DWR, nor any other party
involved in the preparation of this LWSP attests that the data is completely
free of errors and omissions. Furthermore, data users are cautioned that
LWSPs labeled PROVISIONAL have yet to be reviewed by DWR staff. Subsequent
review may result in significant revision. Questions regarding the accuracy
or limitations of usage of this data should be directed to the water system
and/or DWR.
1. System Information
Contact Information
Provisional
| Water System Name: |
Fayetteville |
|
PWSID: |
03-26-010 |
| Mailing Address: | P. O. Box 1089
Fayetteville, NC 28302 | Ownership: | Municipality |
| |
| Contact Person: | Misty Manning | Title: | Chief Operating Officer-W/R |
| Phone: | 910-223-4736 | Cell/Mobile: | -- |
| |
| Secondary Contact: | Jason Green | | Phone: | 910-223-4710 |
| Mailing Address: | 508 Hoffer Drive
Fayetteville, NC 28301 | Cell/Mobile: | -- |
Distribution System
| Line Type |
Size Range (Inches) |
Estimated % of lines |
| Asbestos Cement |
6-16 |
17.13 % |
| Cast Iron |
2-36 |
14.22 % |
| Ductile Iron |
4-54 |
20.44 % |
| Galvanized Iron |
2 |
0.07 % |
| Other |
2-60 |
0.89 % |
| Polyvinyl Chloride |
2-16 |
47.25 % |
Programs
PWC performs unidirectional flushing of all our mains through our hydrants on a five-year cycle. PWC coordinates with area Fire Departments to inspect and repair hydrants annually.
All valves are inspected and operated during the unidirectional flushing program. All valves 16” or larger are exercised on an annual basis.
PWC utilizes various points of mechanical and electronic leak detection devices throughout the system to pinpoint any suspected leakage. Distribution staff utilize field spectrophotometers to determine whether leaks result from leaks or groundwater sources.
We also utilize the following incentive programs to encourage water conservation from our customers:
• Energy Star Clothes Washer - $30 per replacement
• Energy Star Dishwater - $30 per replacement
• High-Efficiency Toilet – ¼ of monthly charge or $75 per unit
• Rain Sensor – up to $50 per installed unit Water Conservation
PWC utilizes the following rate structures:
• “Flat or Fixed” rate is used as a temporary rate
• “Increasing Block” is utilized for residential and irrigation customers
• “Uniform” is used for non-residential, non-residential irrigation, large water customers, and hydrant connections
PWC does have an interconnection with Harnett County via the Town of Spring Lake at Ft. Bragg systems. However, this interconnection has little value in meeting the daily requirements of PWC in case of an emergency. There are no other systems near either the pumping or line capacity to supply PWC’s customer base with water even during an emergency basis. 2. Water Use Information
Service Area
| Sub-Basin(s) | % of Service Population |
|---|
| Cape Fear River (02-3) | 100 % |
|
| County(s) | % of Service Population |
|---|
| Cumberland | 100 % |
|
The system annual service population is the number of metered residential connections multiplied by the “persons per household” (pph) figures derived from the current US Census Bureau “Quick Facts” data for the City of Fayetteville and Cumberland County. The "pph" figures" or have trended downward, in recent years, hence the 2024 service population is slightly lower than the previous year despite new customers being added. Water Use by Type
| Type of Use |
Metered
Connections |
Metered
Average Use (MGD) |
Non-Metered
Connections |
Non-Metered
Estimated Use (MGD) |
| Residential |
86,236 |
10.8650 |
0 |
0.0000 |
| Commercial |
7,119 |
5.6880 |
0 |
0.0560 |
| Industrial |
19 |
2.5820 |
0 |
0.0000 |
| Institutional |
0 |
0.0000 |
0 |
0.0000 |
How much water was used for system processes (backwash, line cleaning, flushing, etc.)? 3.4840 MGD
Water Sales
| Purchaser |
PWSID |
Average
Daily Sold
(MGD) |
Days
Used |
Contract |
Required to
comply with water
use restrictions? |
Pipe Size(s)
(Inches) |
Use
Type |
| MGD |
Expiration |
Recurring |
| Brettonwood Hills |
03-26-286 |
0.0120 |
366 |
0.0288 |
2017 |
Yes |
Yes |
16 |
Regular |
| Brookwood South |
50-26-018 |
0.1720 |
366 |
|
2017 |
Yes |
Yes |
16 |
Regular |
| Cliffdale West |
03-26-332 |
0.0000 |
0 |
|
|
Yes |
Yes |
16 |
Emergency |
| East Gate |
03-26-280 |
0.0160 |
366 |
|
2017 |
Yes |
Yes |
16 |
Regular |
| Fort Bragg |
03-26-344 |
1.5780 |
365 |
4.0000 |
2017 |
Yes |
No |
24 |
Regular |
| Hoke County |
03-47-025 |
1.1540 |
366 |
0.8000 |
2017 |
Yes |
Yes |
16 |
Regular |
| Kelly Hills |
03-26-300 |
0.0060 |
366 |
0.0162 |
2017 |
Yes |
Yes |
8 |
Regular |
| Rain Tree II |
03-26-375 |
0.0180 |
366 |
|
2017 |
Yes |
Yes |
8 |
Regular |
| Stoney Point |
03-26-341 |
0.0000 |
0 |
|
|
Yes |
Yes |
8 |
Emergency |
| Tangelwood South |
03-26-367 |
0.0150 |
365 |
|
2017 |
Yes |
Yes |
8 |
Regular |
| Town of Spring Lake |
03-26-020 |
0.6740 |
366 |
0.7000 |
2017 |
Yes |
Yes |
16 |
Regular |
| Town of Stedman |
03-26-030 |
0.0650 |
366 |
0.1670 |
2017 |
Yes |
Yes |
12 |
Regular |
Brettonwood Hills: no more than 864,000 per month
Fort Liberty: no more than 8 MGD (PWC began supplying 50% of all Ft Liberty water in 2010)
Hoke County: no more than 42,000,000 per month
Kelly Hills: no more than 486,000 per month
Spring Lake: 13,000,000 per month*
Stedman: no less than 1,035,000 and no more than 5,000,000 per month
*The minimum purchase for Spring Lake is 13,000,000 gal per month (.433 MGD). An upper purchase limit has not been set.
In order for Spring Lake to meet their projected demand with no more than 80% of supply, a purchase amount of 0.700 MGD
would be required from Fayetteville according to the 2023 LWSP.
The 2024 LWSP for Spring Lake has not been submitted at the time of plan review for Fayetteville.
Harnett Regional Water System and Fayetteville PWC jointly provide water sales to Fort Bragg. The 8.0 MGD contract sales is split between the systems in the LWSP. Harnett County shows selling (2.9932 MGD for 183 days = 1.4966 MGD for the year) and Fayetteville shows selling 1.578 MGD for the year.
3. Water Supply Sources
Monthly Withdrawals & Purchases
|
Average Daily
Use (MGD) |
Max Day
Use (MGD) |
|
Average Daily
Use (MGD) |
Max Day
Use (MGD) |
|
Average Daily
Use (MGD) |
Max Day
Use (MGD) |
| Jan |
26.7370 |
31.6090 |
May |
29.2390 |
31.7340 |
Sep |
29.1770 |
33.4910 |
| Feb |
26.0540 |
30.2110 |
Jun |
34.1220 |
40.4990 |
Oct |
30.1960 |
32.6820 |
| Mar |
26.4260 |
32.4400 |
Jul |
32.0570 |
37.0790 |
Nov |
28.1020 |
31.0120 |
| Apr |
28.0750 |
31.5590 |
Aug |
31.1150 |
36.8810 |
Dec |
25.5500 |
30.4030 |

Surface Water Sources
| Stream |
Reservoir |
Average Daily Withdrawal |
Maximum Day
Withdrawal (MGD) |
Available Raw
Water Supply |
Usable On-Stream
Raw Water Supply
Storage (MG) |
| MGD |
Days Used |
MGD |
* Qualifier |
| Big Cross Creek |
|
0.0000 |
0 |
0.0000 |
0.9000 |
F |
0.0000 |
| Cape Fear - 2 |
|
19.6000 |
366 |
0.0000 |
40.4000 |
F |
0.0000 |
| Cape Fear River - 1 |
|
9.6800 |
293 |
0.0000 |
40.4000 |
F |
0.0000 |
| Little Cross Creek |
Glenville Lake |
7.6100 |
53 |
0.0000 |
5.0000 |
SY50 |
250.0000 |
* Qualifier: C=Contract Amount, SY20=20-year Safe Yield, SY50=50-year Safe Yield, F=20% of 7Q10 or other instream flow requirement, CUA=Capacity Use Area Permit
Surface Water Sources (continued)
| Stream |
Reservoir |
Drainage Area
(sq mi) |
Metered? |
Sub-Basin |
County |
Year
Offline |
Use
Type |
| Big Cross Creek |
|
15 |
No |
Cape Fear River (02-3) |
Cumberland |
|
Emergency |
| Cape Fear - 2 |
|
4,360 |
Yes |
Cape Fear River (02-3) |
Cumberland |
|
Regular |
| Cape Fear River - 1 |
|
4,360 |
Yes |
Cape Fear River (02-3) |
Cumberland |
|
Regular |
| Little Cross Creek |
Glenville Lake |
9 |
Yes |
Cape Fear River (02-3) |
Cumberland |
|
Regular |
Water Treatment Plants
| Plant Name |
Permitted Capacity
(MGD) |
Is Raw Water Metered? |
Is Finished Water Ouput Metered? |
Source |
| Glenville Lake WTF |
18.0000 |
Yes |
Yes |
Glenville Lake, Cape Fear River |
| P.O. Hoffer WTF |
39.5000 |
Yes |
Yes |
Cape Fear River |
PWC has reported its Cape Fear River available raw water supply as 85.8 MGD (i.e., 42.9 MGD allocated to each of our two intakes). This value is based on a USGS study titled “Low-Flow Characteristics and Discharge Profiles for Selected Streams in the Cape Fear River Basin, North Carolina”, through 1998 in which the historical 7Q10 flow in the Cape Fear River at Fayetteville was estimated as 625 CFS or 404 MGD. Therefore, 80.8 MGD represents 20% of this 7Q10 value. Combined with the additional 5 MGD available from Glenville Lake, PWC has an estimated available Cape Fear River supply of 85.8 MGD. During Round 4 of the Jordan Lake water supply allocation process, DWR instruction to applicants with run-of-river sources was that available supply is assumed to be 20% of the 7Q10 flow as determined using the base-case scenario of the appropriate river basin hydrologic model. At Lock & Dam #3, the basin model (for the 2045 Baseline scenario) showed 7Q10 of 236 MGD, and 20% of that 7Q10 is 47.2 MGD. PWC requested a Jordan Lake allocation since its projected future demands are well over the calculated 47.2 MGD. However, the State did not grant this request and indicated in its Round 4 decision documentation that an approach using PWC net withdrawals (i.e., factoring in wastewater return flows) to compare against 20% of 7Q10 would mean far more available Cape Fear River supply for PWC.
According to Appendix B “Water Availability Behind Lock and Dam #3” of DWR’s December 2016 Cape Fear River Surface Water Supply Evaluation, Fayetteville PWC may be able to withdraw 174.5 MGD from behind Lock & Dam # 3, on an average day basis, without reducing the model-generated 7Q10 flow by more than 20 percent. Because this estimate is based on net withdrawals it depends on Fayetteville’s ability to maintain a similar ratio of wastewater discharges to water withdrawals in the future. On April 4, 2017, the EMC in its final decision inserted this same Appendix B into DWR’s Round 4 Jordan Lake Water Supply Allocation Recommendations.
Minimum flow of 4 CFS must be maintained downstream of the Glenville Lake dam.
Little Cross Creek feeds four impoundments, which have a total capacity of 250 Million Gallons. This was considered by NCPWS as off-line storage when the P.O. Hoffer WTF was granted an uprating.
PWC has completed the design for a 16 MGD treatment capacity expansion at the PO Hoffer Water Treatment Plant (from 32 MGD to 48 MGD). The projected date for beginning construction is the year 2027 unless system demand increases dictate beginning sooner. 4. Wastewater Information
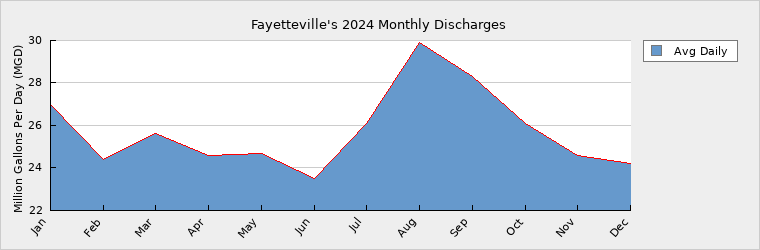
Monthly Discharges
|
Average Daily
Discharge (MGD) |
|
Average Daily
Discharge (MGD) |
|
Average Daily
Discharge (MGD) |
| Jan |
27.0000 |
May |
24.7000 |
Sep |
28.3000 |
| Feb |
24.4000 |
Jun |
23.5000 |
Oct |
26.1000 |
| Mar |
25.6000 |
Jul |
26.1000 |
Nov |
24.6000 |
| Apr |
24.6000 |
Aug |
29.9000 |
Dec |
24.2000 |
Design for the Rockfish Creek WRF Phase 3 Expansion project (21 MGD to 28 MGD) is complete with construction ac tentatively scheduled for FY28. PWC has on record an Environmental Assessment (EA) to expand the current rated capacity of 21 MGD to the new permitted 28 MGD for future planning purposes. Wastewater Permits
| Permit Number |
Type |
Permitted Capacity
(MGD) |
Design Capacity
(MGD) |
Average Annual
Daily Discharge
(MGD) |
Maximum Day Discharge
(MGD) |
Receiving Stream |
Receiving Basin |
| NC0023957 |
WWTP |
25.0000 |
25.0000 |
11.2000 |
29.7000 |
Cape Fear River |
Cape Fear River (02-3) |
| NC0050105 |
WWTP |
21.0000 |
21.0000 |
14.7000 |
30.2000 |
Cape Fear River |
Cape Fear River (02-3) |
Wastewater Interconnections
| Water System |
PWSID |
Type |
Average Daily Amount |
Contract
Maximum (MGD) |
| MGD |
Days Used |
| Cliffdale West |
03-26-010 |
Receiving |
0.0000 |
365 |
|
| Eastover Sanitary District |
50-26-027 |
Receiving |
0.0990 |
365 |
0.5940 |
| Hoke County |
03-47-025 |
Receiving |
0.0110 |
365 |
0.5000 |
| NORCRESS |
00-00-000 |
Receiving |
0.1150 |
365 |
0.4000 |
| Town of Stedman |
03-26-030 |
Receiving |
0.1760 |
365 |
|
Fayetteville PWC owns the Cliffdale West wastewater system, i.e., gravity lines and lift stations, but does not monitor the individual flow. Fayetteville accounts for the flow from Cliffdale West in their total discharge.
The wastewater discharge from NORCRESS includes the combined flow from collections systems for the Town of Wade, the Town of Falcon and the Town of Godwin. 5. Planning
Projections
| |
2024 |
2030 |
2040 |
2050 |
2060 |
2070 |
| Year-Round Population |
206,281 |
281,172 |
332,134 |
348,741 |
366,178 |
384,486 |
| Seasonal Population |
0 |
0 |
0 |
0 |
0 |
0 |
| |
| Residential |
10.8650 |
15.5410 |
18.3570 |
19.2750 |
20.2390 |
21.2510 |
| Commercial |
5.7440 |
8.8670 |
10.4740 |
10.9970 |
11.5470 |
12.1250 |
| Industrial |
2.5820 |
6.4740 |
10.4340 |
15.4940 |
20.5540 |
25.6140 |
| Institutional |
0.0000 |
0.0000 |
0.0000 |
0.0000 |
0.0000 |
0.0000 |
| System Process |
3.4840 |
6.1630 |
6.1630 |
6.1630 |
6.1630 |
6.1630 |
| Unaccounted-for |
2.0707 |
3.6080 |
4.5110 |
5.2150 |
5.9430 |
6.6660 |
Future service population projections are based on an assumed percentage of the total Cumberland County population being served. Continuing the trend begun in 2016, the current year 2024 “Annual County Population Totals” from the NC State Office of Management are virtually flat for Cumberland County over the 30-year planning horizon. For the years 2016 through 2020, Fayetteville PWC reverted to the 2015 OMB numbers for LWSP population projections. For the LWSP 2021 Update and beyond, we projected 10-year population increases based on the approximate 5% growth in Cumberland County between years 2010 and 2020 per US Census data as provided by the Cumberland County Planning Department.
Projections for industrial demand include a substantial allowance for addition of potential large water users.
Future Water Sales
| Purchaser |
PWSID |
Contract |
Pipe Size(s) (Inches) |
Use Type |
| MGD |
Year Begin |
Year End |
| Fort Bragg - ONUS |
03-26-344 |
0.0060 |
2030 |
2031 |
30 |
Regular |
| Fort Bragg - ONUS |
03-26-344 |
0.0840 |
2040 |
2041 |
30 |
Regular |
| Fort Bragg - ONUS |
03-26-344 |
0.1650 |
2050 |
2051 |
30 |
Regular |
| Fort Bragg - ONUS |
03-26-344 |
0.2010 |
2060 |
2061 |
30 |
Regular |
| Fort Bragg - ONUS |
03-26-344 |
0.2640 |
2070 |
2071 |
30 |
Regular |
| Hoke County Regional Water System |
03-47-025 |
0.3510 |
2070 |
2071 |
16 |
Regular |
| Hoke County Regional Water System |
03-47-025 |
0.2190 |
2060 |
2061 |
16 |
Regular |
| Town of Stedman |
03-26-030 |
0.0500 |
2030 |
2031 |
12 |
Regular |
| Town of Stedman |
03-26-030 |
0.0710 |
2040 |
2041 |
12 |
Regular |
| Town of Stedman |
03-26-030 |
0.0890 |
2050 |
2051 |
12 |
Regular |
| Town of Stedman |
03-26-030 |
0.1120 |
2060 |
2061 |
12 |
Regular |
| Town of Stedman |
03-26-030 |
0.1410 |
2070 |
2071 |
12 |
Regular |
Sales projections for PWCs three major bulk water customers are provided in the above table. The estimated figures represent the relative increase in sales over the respective 10-year reporting periods and are based on total demand data taken from those systems most recent available LWSP Update and the current trending for percentage of total system demand provided by PWC as follows:
(1) Fort Bragg MB (50%)
(2) Hoke County Regional Water System (30%)
(3) Town of Stedman (100%) Demand v/s Percent of Supply
| |
2024 |
2030 |
2040 |
2050 |
2060 |
2070 |
| Surface Water Supply |
85.8000 |
85.8000 |
85.8000 |
85.8000 |
85.8000 |
85.8000 |
| Ground Water Supply |
0.0000 |
0.0000 |
0.0000 |
0.0000 |
0.0000 |
0.0000 |
| Purchases |
0.0000 |
0.0000 |
0.0000 |
0.0000 |
0.0000 |
0.0000 |
| Future Supplies |
0.0000 |
0.0000 |
0.0000 |
0.0000 |
0.0000 |
| Total Available Supply (MGD) |
85.8000 |
85.8000 |
85.8000 |
85.8000 |
85.8000 |
85.8000 |
| Service Area Demand |
24.7457 |
40.6530 |
49.9390 |
57.1440 |
64.4460 |
71.8190 |
| Sales |
3.7056 |
6.2870 |
6.2870 |
6.2870 |
6.2870 |
6.2870 |
| Future Sales |
0.0560 |
0.1550 |
0.2540 |
0.5320 |
0.7560 |
| Total Demand (MGD) |
28.4513 |
46.9960 |
56.3810 |
63.6850 |
71.2650 |
78.8620 |
| Demand as Percent of Supply |
33% |
55% |
66% |
74% |
83% |
92% |

The purpose of the above chart is to show a general indication of how the long-term per capita water demand changes over time. The per capita water demand may actually be different than indicated due to seasonal populations and the accuracy of data submitted. Water systems that have calculated long-term per capita water demand based on a methodology that produces different results may submit their information in the notes field.
Your long-term water demand is 53 gallons per capita per day. What demand management practices do you plan to implement to reduce the per capita water demand (i.e. conduct regular water audits, implement a plumbing retrofit program, employ practices such as rainwater harvesting or reclaimed water)? If these practices are covered elsewhere in your plan, indicate where the practices are discussed here.
Are there other demand management practices you will implement to reduce your future supply needs?
What supplies other than the ones listed in future supplies are being considered to meet your future supply needs?
How does the water system intend to implement the demand management and supply planning components above?
Additional Information
Has this system participated in regional water supply or water use planning? Yes, Yes, PWC has participated in the Cape Fear River Water Supply Plan and the Cape Fear Lock and Dam Study. PWC has also been coordinating with Ft. Bragg and BRAC with regards to current and future regional water needs/expectations.
What major water supply reports or studies were used for planning? PWC Water System Master Plan, 2002 Update (CDM)
Cumberland County Rural Water Demands and Preliminary Water District Evaluation (CDM, May 2001)
Cumberland County Preliminary Siting and Reservoir Feasibility Study (Geometrics Engineering, January 2000)
Site Feasibility Study for the P.O. Hoffer Raw Water Impoundment (CDM, July 1998)
Implementation of an Aquifer Storage and Recovery System, PER (Hazen and Sawyer, May 1997)
Cape Fear River Surface Water Supply Evaluation (DWR, December 2016)
Preliminary Engineering Report - PO Hoffer Water Treatment Facility Expansion to 48 MGD (November 2011)
Please describe any other needs or issues regarding your water supply sources, any water system deficiencies or needed improvements (storage, treatment, etc.) or your ability to meet present and future water needs. Include both quantity and quality considerations, as well as financial, technical, managerial, permitting, and compliance issues: For the distribution system, PWC has implemented an annual program for rehabilitating selected water mains via an epoxy or cement mortar lining system. These mains are predominately unlined cast-iron pipe that have tuberculated with age.
PWC intake operations and water availability based on net withdrawal assumptions depend on pooled water in the Cape Fear River maintained by Lock & Dam No. 3 downstream of the PWC intakes. The Corps of Engineers is now conducting a Disposition Study that may affect the future condition and/or ownership of Lock & Dam No. 3.
The Division of Water Resources (DWR) provides the data contained within this
Local Water Supply Plan (LWSP) as a courtesy and service to our customers.
DWR staff does not field verify data. Neither DWR, nor any other party
involved in the preparation of this LWSP attests that the data is completely
free of errors and omissions. Furthermore, data users are cautioned that
LWSPs labeled PROVISIONAL have yet to be reviewed by DWR staff. Subsequent
review may result in significant revision. Questions regarding the accuracy
or limitations of usage of this data should be directed to the water system
and/or DWR.
|