|
The Division of Water Resources (DWR) provides the data contained within this
Local Water Supply Plan (LWSP) as a courtesy and service to our customers.
DWR staff does not field verify data. Neither DWR, nor any other party
involved in the preparation of this LWSP attests that the data is completely
free of errors and omissions. Furthermore, data users are cautioned that
LWSPs labeled PROVISIONAL have yet to be reviewed by DWR staff. Subsequent
review may result in significant revision. Questions regarding the accuracy
or limitations of usage of this data should be directed to the water system
and/or DWR.
1. System Information
Contact Information
Complete
| Water System Name: |
Durham |
|
PWSID: |
03-32-010 |
| Mailing Address: | 101 City Hall Plaza
Durham, NC 27701 | Ownership: | Municipality |
| |
| Contact Person: | Reginald Hicks | Title: | Water Resources Manager |
| Phone: | 919-560-4381 | Cell/Mobile: | -- |
| |
| Secondary Contact: | Sydney Miller | | Phone: | 919-560-4381 |
| Mailing Address: | 1600 Mist Lake Drive
Durham, NC 27704 | Cell/Mobile: | -- |
Distribution System
| Line Type |
Size Range (Inches) |
Estimated % of lines |
| Asbestos Cement |
6-8 |
0.04 % |
| Cast Iron |
2-24 |
23.35 % |
| Ductile Iron |
1-9 |
76.26 % |
| Other |
1-12 |
0.35 % |
1. The City has a robust rehabilitation and replacement strategy for the distribution system. In addition to replacing 80+ year old pipes in the downtown area, the City continues to replace AC water lines.
2. The City continoually improves its distribution system data. As such, lines identified as type unknown or misidentified are reclassified as data improve.
3. Previous estimations of distribution lines included other pipes, such as blow offs, bypasses, and hydrant lines. This estimation is now limited to distribution system mains.
4. All of the customer water meters have now been replaced with AMR meters. Programs
1. The department continues a successful collaboration with the Fire Department (FD) in which FD staff regularly exercise hydrants. When problems are found, they generate work orders for Water & Sewer Maintenance staff. This continues to increase the reliability of the system for fire protection.
2. In addition to offering low cost/no cost water efficiency devices at community events and at City Hall, the City also incents the replacement of water wasting toilets by offering a credit on customer water bills of up to $100 when replaced with EPA WaterSense toilets. Staff are exploring opportunities to work more closely with low-income customers regarding the toilet replacement program. Conservation staff have an ongoing presence in the community, actively promoting water efficiency at more than 69 public events during the year and maintaining an active presence on website and social media.
3. Crews are deployed in the field periodically using ultrasonic listening devices. A more proactive program will be explored in the future. Water Conservation
1. The City has an increasing block rate for single family residential customers who are billed for water with a 5 tiered system. Commercial/Industrial/Institutional customers are billed at Tier 3. Irrigation customers are billed at Tier 5. Sewer for all customers is billed at a flat rate.
2. The North Durham Water Reclamation Facility (NDWRF) dispenses bulk reclaimed water. NDWRF also supplies the Mist Lake Administration Building with reclaimed water for toilet flushing. The South Durham Water Reclamation Facility (SDWRF) bulk reclaimed water system is not currently active. The SDWRF also supplies the Compliance Services Building with reclaimed water for toilet flushing. Reclaimed/Reused water is used internally for processes at both NDWRF and SDWRF.
3. Durham has 9 interconnections with other towns and utilities for emergency use. Cary and OWASA are ""on call"" for planned maintenance activities; this is reciprocated by Durham. 2. Water Use Information
Service Area
| Sub-Basin(s) | % of Service Population |
|---|
| Neuse River (10-1) | 51 % |
| Haw River (02-1) | 49 % |
|
| County(s) | % of Service Population |
|---|
| Durham | 100 % |
|
Water Use by Type
| Type of Use |
Metered
Connections |
Metered
Average Use (MGD) |
Non-Metered
Connections |
Non-Metered
Estimated Use (MGD) |
| Residential |
99,722 |
14.0200 |
0 |
0.0000 |
| Commercial |
6,155 |
7.6100 |
0 |
0.0000 |
| Industrial |
128 |
2.1300 |
0 |
0.0000 |
| Institutional |
1,219 |
2.9600 |
0 |
0.0000 |
How much water was used for system processes (backwash, line cleaning, flushing, etc.)? 1.9618 MGD
Water Sales
| Purchaser |
PWSID |
Average
Daily Sold
(MGD) |
Days
Used |
Contract |
Required to
comply with water
use restrictions? |
Pipe Size(s)
(Inches) |
Use
Type |
| MGD |
Expiration |
Recurring |
| Cary |
03-92-020 |
0.0000 |
0 |
|
2028 |
Yes |
Yes |
16 |
Emergency |
| Chatham Co (North) |
03-19-126 |
0.1700 |
366 |
4.0000 |
2031 |
No |
Yes |
16 |
Regular |
| City of Raleigh |
03-92-010 |
0.0000 |
0 |
|
2043 |
Yes |
No |
24 |
Emergency |
| Hillsborough |
03-68-015 |
0.0000 |
0 |
|
2025 |
Yes |
Yes |
16 |
Emergency |
| Orange-Alamance |
03-68-020 |
0.0000 |
0 |
|
|
No |
Yes |
|
Emergency |
| OWASA |
03-68-010 |
1.0530 |
3 |
|
2029 |
No |
Yes |
12 |
Emergency |
1. The agreement with Chatham County has a duration that continues until the date that the Regional Water Treatment Facility on the west side of B. Everett Jordan Lake is fully operational, currently estimated as the year 2031.
2 The agreement for Mutual Aid with Orange-Alamance requires transfer of water through the Hillsborough interconnection.
3. Water Supply Sources
Monthly Withdrawals & Purchases
|
Average Daily
Use (MGD) |
Max Day
Use (MGD) |
|
Average Daily
Use (MGD) |
Max Day
Use (MGD) |
|
Average Daily
Use (MGD) |
Max Day
Use (MGD) |
| Jan |
28.9600 |
34.5000 |
May |
31.5900 |
36.0600 |
Sep |
35.5700 |
37.3300 |
| Feb |
29.4200 |
32.1000 |
Jun |
37.7400 |
46.6500 |
Oct |
35.0100 |
37.3600 |
| Mar |
32.5300 |
38.2000 |
Jul |
35.9400 |
41.9000 |
Nov |
32.3900 |
36.5800 |
| Apr |
31.4100 |
36.7300 |
Aug |
37.5100 |
42.9600 |
Dec |
29.2100 |
34.4500 |

Surface Water Sources
| Stream |
Reservoir |
Average Daily Withdrawal |
Maximum Day
Withdrawal (MGD) |
Available Raw
Water Supply |
Usable On-Stream
Raw Water Supply
Storage (MG) |
| MGD |
Days Used |
MGD |
* Qualifier |
| Cape Fear |
Jordan Lake |
0.0000 |
0 |
0.0000 |
16.5000 |
SY50 |
2,462.0000 |
| Eno River |
|
0.0000 |
0 |
0.0000 |
5.0000 |
CUA |
0.0000 |
| Eno River |
Teer/Hanson Quarry |
0.0000 |
0 |
0.0000 |
6.2000 |
SY50 |
0.0000 |
| Flat River |
Lake Michie |
22.2700 |
261 |
31.3200 |
11.3000 |
SY50 |
2,691.0000 |
| Little River |
Little River Reservoir |
18.0700 |
349 |
36.5000 |
15.6000 |
SY50 |
4,484.0000 |
* Qualifier: C=Contract Amount, SY20=20-year Safe Yield, SY50=50-year Safe Yield, F=20% of 7Q10 or other instream flow requirement, CUA=Capacity Use Area Permit
Surface Water Sources (continued)
| Stream |
Reservoir |
Drainage Area
(sq mi) |
Metered? |
Sub-Basin |
County |
Year
Offline |
Use
Type |
| Cape Fear |
Jordan Lake |
1,690 |
Yes |
Haw River (02-1) |
Chatham |
|
Regular |
| Eno River |
|
144 |
Yes |
Neuse River (10-1) |
Chatham |
|
Emergency |
| Eno River |
Teer/Hanson Quarry |
0 |
Yes |
Neuse River (10-1) |
Durham |
|
Emergency |
| Flat River |
Lake Michie |
168 |
Yes |
Neuse River (10-1) |
Durham |
|
Regular |
| Little River |
Little River Reservoir |
97 |
Yes |
Neuse River (10-1) |
Durham |
|
Regular |
1. Changes in safe yields and raw water supply storage for Lake Michie and Little River Reservoir are a result of recent bathymetric surveys completed in 2022.
2. 135 MG off-stream raw water storage is the combined capacity of terminal reservoirs at Brown WTP (90) MG) and Williams WTP (45 MG).
3. Durham can only access its Jordan Lake allocation as treated water via the Town of Cary. Withdrawals form Cape Fear/Jordan Lake are reported as purchases from Town of Cary to prevent double counting.
4. The Western Intake Partnership, which includes the City of Durham, has begun the process of developing a new western intake structure on Jordan Lake (with 3 partners) with a regional water treatment facility and associated transmission lines to serve the partners.
5. Durham has a required minimum release for the Little River Dam & Reservoir. Durham recently installed the infrastructure necessary to make a minimum release from Lake Michie which began operation in December 2019.
6. Full utilization of Teer Quarry is planned as off-line storage with an estimated volume of 1,480 MG. Water Purchases From Other Systems
| Seller |
PWSID |
Average
Daily Purchased
(MGD) |
Days
Used |
Contract |
Required to
comply with water
use restrictions? |
Pipe Size(s)
(Inches) |
Use
Type |
| MGD |
Expiration |
Recurring |
| Cary |
03-92-020 |
0.0000 |
0 |
|
2028 |
Yes |
Yes |
16 |
Emergency |
| Chatham Co |
03-19-126 |
0.0000 |
0 |
|
2035 |
No |
Yes |
16 |
Emergency |
| City of Raleigh |
03-92-010 |
0.0000 |
0 |
|
2043 |
Yes |
Yes |
24 |
Emergency |
| Hillsborough |
03-68-015 |
0.0000 |
0 |
|
2025 |
Yes |
Yes |
16 |
Emergency |
| Orange-Alamance |
03-68-020 |
0.0000 |
0 |
|
|
No |
Yes |
|
Emergency |
| OWASA |
03-68-010 |
0.0000 |
0 |
|
2029 |
Yes |
Yes |
12 |
Emergency |
1. The water purchased from the Town of Cary comes from the City of Durham's Jordan Lake water supply storage allocation. The Town of Cary reports this as a sale to Durham in its Local Water Supply Plan. In order to prevent double counting, this flow is not being reported as a surface water withdrawal by Durham in Surface Water Sources, above. Water Treatment Plants
| Plant Name |
Permitted Capacity
(MGD) |
Is Raw Water Metered? |
Is Finished Water Ouput Metered? |
Source |
| Brown Water Treatment Plant |
42.0000 |
Yes |
Yes |
Lake Michie, Little River |
| Williams Water Treatment Plant |
22.0000 |
Yes |
Yes |
Lake Michie, Little River |
The expansion at the Brown Treatment Plant from 30 MGD to 42 MGD addressed peak demands. Construction was completed in 2020. 4. Wastewater Information
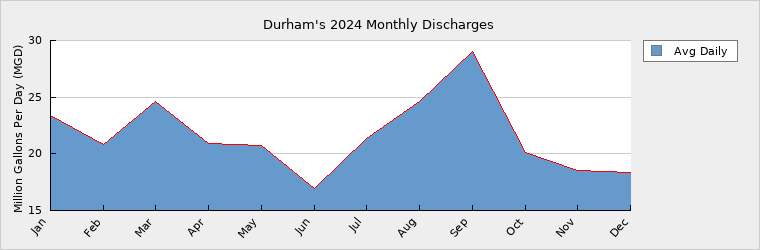
Monthly Discharges
|
Average Daily
Discharge (MGD) |
|
Average Daily
Discharge (MGD) |
|
Average Daily
Discharge (MGD) |
| Jan |
23.3700 |
May |
20.7400 |
Sep |
29.0300 |
| Feb |
20.8400 |
Jun |
16.9800 |
Oct |
20.1500 |
| Mar |
24.6200 |
Jul |
21.3700 |
Nov |
18.5300 |
| Apr |
20.8900 |
Aug |
24.6000 |
Dec |
18.3700 |
1. The number of service connections with septic systems is based on the number of water-only accounts and parcel-based information from the Durham County Department of Public Health, Onsite Water Protection.
2. Both NDWRF and SDWRF have improvements under construction for side stream treatment to meet more stringent nutrient limits. No capacity expansion is planned.
Wastewater Permits
| Permit Number |
Type |
Permitted Capacity
(MGD) |
Design Capacity
(MGD) |
Average Annual
Daily Discharge
(MGD) |
Maximum Day Discharge
(MGD) |
Receiving Stream |
Receiving Basin |
| NC0023841 |
WWTP |
20.0000 |
20.0000 |
10.6700 |
34.4300 |
Ellerbee Creek |
Neuse River (10-1) |
| NC0047957 |
WWTP |
20.0000 |
20.0000 |
10.9600 |
33.4900 |
New Hope Creek |
Haw River (02-1) |
Wastewater Interconnections
| Water System |
PWSID |
Type |
Average Daily Amount |
Contract
Maximum (MGD) |
| MGD |
Days Used |
| Durham Co. WWTP |
03-32-010 |
Discharging |
2.6670 |
366 |
|
This meter was in service for the entire year.
The 2.667 MGD sent to Durham County WWTP is not included in monthly flows. The same methodology has been used for the past 9 years. 5. Planning
Projections
| |
2024 |
2030 |
2040 |
2050 |
2060 |
2070 |
| Year-Round Population |
333,490 |
351,379 |
397,215 |
443,341 |
487,444 |
531,546 |
| Seasonal Population |
0 |
0 |
0 |
0 |
0 |
0 |
| |
| Residential |
14.0200 |
15.5800 |
16.9600 |
18.6100 |
20.3100 |
22.0400 |
| Commercial |
7.6100 |
5.7300 |
6.6300 |
8.2200 |
9.6600 |
11.1400 |
| Industrial |
2.1300 |
1.3900 |
1.3800 |
1.3800 |
1.3800 |
1.4100 |
| Institutional |
2.9600 |
2.9200 |
2.8400 |
3.5200 |
4.1400 |
4.7700 |
| System Process |
1.9618 |
0.6800 |
0.7400 |
0.8400 |
0.9400 |
1.0400 |
| Unaccounted-for |
4.2513 |
3.8939 |
4.2270 |
4.8222 |
5.3937 |
5.9814 |
Population projections from LRWRP Table 6-2
Water Use Projections from LRWRP Table 6-9
Future Supply Sources
| Source Name |
PWSID |
Source Type |
Additional Supply |
Year Online |
Year Offline |
Type |
| Teer Quarry |
03-32-010 |
Surface |
6.2000 |
2025 |
|
Regular |
Demand v/s Percent of Supply
| |
2024 |
2030 |
2040 |
2050 |
2060 |
2070 |
| Surface Water Supply |
43.4000 |
43.4000 |
43.4000 |
43.4000 |
43.4000 |
43.4000 |
| Ground Water Supply |
0.0000 |
0.0000 |
0.0000 |
0.0000 |
0.0000 |
0.0000 |
| Purchases |
0.0000 |
0.0000 |
0.0000 |
0.0000 |
0.0000 |
0.0000 |
| Future Supplies |
6.2000 |
6.2000 |
6.2000 |
6.2000 |
6.2000 |
| Total Available Supply (MGD) |
43.4000 |
49.6000 |
49.6000 |
49.6000 |
49.6000 |
49.6000 |
| Service Area Demand |
32.9331 |
30.1939 |
32.7770 |
37.3922 |
41.8237 |
46.3814 |
| Sales |
0.1786 |
4.0000 |
0.0000 |
0.0000 |
0.0000 |
0.0000 |
| Future Sales |
0.0000 |
0.0000 |
0.0000 |
0.0000 |
0.0000 |
| Total Demand (MGD) |
33.1117 |
34.1939 |
32.7770 |
37.3922 |
41.8237 |
46.3814 |
| Demand as Percent of Supply |
76% |
69% |
66% |
75% |
84% |
94% |

The purpose of the above chart is to show a general indication of how the long-term per capita water demand changes over time. The per capita water demand may actually be different than indicated due to seasonal populations and the accuracy of data submitted. Water systems that have calculated long-term per capita water demand based on a methodology that produces different results may submit their information in the notes field.
Your long-term water demand is 42 gallons per capita per day. What demand management practices do you plan to implement to reduce the per capita water demand (i.e. conduct regular water audits, implement a plumbing retrofit program, employ practices such as rainwater harvesting or reclaimed water)? If these practices are covered elsewhere in your plan, indicate where the practices are discussed here.
We are not making any changes at present. However, we are currently engaged in a Long Range Water Resources Plan project that includes an evaluation of our current water efficiency and conservation programs and the development of a new water efficiency and conservation plan.
Are there other demand management practices you will implement to reduce your future supply needs? 1. Durham will continue to implement and expand its robust water conservation/efficiency program, including enforcement of the Alternate Day Watering schedule and conducting Water Use Assessments for residential and small commercial customers.
2. Durham has a contract with Waste Reduction Partners to provide water assessments for our larger industrial, commercial, and institutional customers.
3. Durham will continue to explore expanded leak detection activities that will augment the current data-logging to extract information from electronic meters.
4. City Council and Administration continue to support pricing signals by approving incremental adjustments to the tiered rate structure for single family residential water customers. The City also plans to evaluate alternative rate structures or budget-based rates.
5. A Master Plan for a robust reclaimed water system was completed in 2017 with the long-term goal of off-setting potable water demands.
What supplies other than the ones listed in future supplies are being considered to meet your future supply needs? The City will continue to consider the expansion of Lake Michie as a potential future supply.
How does the water system intend to implement the demand management and supply planning components above? 1. The demand management components listed above are already being implemented.
2. The Western Intake Partnership (a subset of the Triangle Water Supply Partnership) completed a feasibility study for the construction of an intake on the western shore of Jordan Lake, a regional water treatment plant to serve the needs of Durham, Chatham County, Pittsboro and others in the vicinity, as well as other infrastructure needed to deliver potable water to these growing communities.
3. The Western Intake Partnership has launched 4 preliminary projects: Raw Water Intake & Transmission Infrastructure; Governance; Environmental Permitting; and Water Treatment Facility.
Additional Information
Has this system participated in regional water supply or water use planning? Yes, 1. The City of Durham continues to actively engage in regional planning efforts.
2. The City of Durham is a lead agency in the Triangle Water Supply Partnership (TWSP) which evolved from the Jordan Lake Partnership created by 13 local governments and water systems in 2009 to actively plan for secure and sustainable regional water supply.
3. The award-winning Triangle Regional Water Supply Plan is currently being
updated by the TWSP.
4. In addition to TWSP planning activities, the City participates in other planning efforts which include the Triangle Area Water Supply Monitoring Partnership, Jordan Lake One Water, Upper Neuse River Basin Association, and Upper Cape Fear Basin Association.
What major water supply reports or studies were used for planning? 1. Demand Projections in Section 5 are from the City of Durham Water Demand Projections (2023), and are defined as the Baseline Scenario Water Demand Projections. These baseline projections may change slightly as we continue working on our Long Range Water Resources Plan, expected to be completed in calendar year 2025.
2. Several City plans were updated and used as resources for the Triangle Regional Water Supply Plan (TRWSP). Additional documents were prepared in support of the Environmental Assessment (EA) document for the expansion and upgrades to the Brown and Williams Water Treatment Plants.
3. Water Treatment Facility and Water Reclamation Facility Master Plans have been completed.
4. The Teer Quarry PER Update provided information for the local water supply plan as did the Reclaimed Water Master Plan.
5. Durham continues to participate in a number of studies by UNC faculty/graduate students through the Water Resources Research Institute/Urban Water Consortium to evaluate models for transferring water between regional systems to maximize system yields.
6. The Triangle Water Supply Partnership recently updated the interconnection study that was conducted by the Jordan Lake Partnership.
Please describe any other needs or issues regarding your water supply sources, any water system deficiencies or needed improvements (storage, treatment, etc.) or your ability to meet present and future water needs. Include both quantity and quality considerations, as well as financial, technical, managerial, permitting, and compliance issues: 1. The long term needs for Durham can be met by securing access to the current Jordan Lake allocation and by using Teer Quarry as a regular supply.
2. Both Lake Michie and Little River are very protected water sources, but the City is expanding water quality monitoring and adding treatment options.
3. The City continues to invest millions of dollars to renew and rehabilitate the dam structures at the two reservoirs as well as maintain and rehabilitate the treatment facilities and distribution system to ensure compliance with current and future regulations.
4. Durham has invested in 9 interconnections with neighboring systems to ensure the ability to meet customer demand when there are issues within the system.
The Division of Water Resources (DWR) provides the data contained within this
Local Water Supply Plan (LWSP) as a courtesy and service to our customers.
DWR staff does not field verify data. Neither DWR, nor any other party
involved in the preparation of this LWSP attests that the data is completely
free of errors and omissions. Furthermore, data users are cautioned that
LWSPs labeled PROVISIONAL have yet to be reviewed by DWR staff. Subsequent
review may result in significant revision. Questions regarding the accuracy
or limitations of usage of this data should be directed to the water system
and/or DWR.
|