|
The Division of Water Resources (DWR) provides the data contained within this
Local Water Supply Plan (LWSP) as a courtesy and service to our customers.
DWR staff does not field verify data. Neither DWR, nor any other party
involved in the preparation of this LWSP attests that the data is completely
free of errors and omissions. Furthermore, data users are cautioned that
LWSPs labeled PROVISIONAL have yet to be reviewed by DWR staff. Subsequent
review may result in significant revision. Questions regarding the accuracy
or limitations of usage of this data should be directed to the water system
and/or DWR.
1. System Information
Contact Information
Provisional
| Water System Name: |
Harnett Regional Water System |
|
PWSID: |
03-43-045 |
| Mailing Address: | P. O. Box 1119
Lillington, NC 27546 | Ownership: | County |
| |
| Contact Person: | Allan O'Briant | Title: | Water Plant Supervisor |
| Phone: | 910-893-7575 | Cell/Mobile: | 910-984-6894 |
| |
| Secondary Contact: | Tommy Burns | | Phone: | 910-814-3042 |
| Mailing Address: | P. O. Box 1119
Lillington, NC 27546 | Cell/Mobile: | 910-984-6894 |
Distribution System
| Line Type |
Size Range (Inches) |
Estimated % of lines |
| Asbestos Cement |
6-16 |
0.34 % |
| Ductile Iron |
4-36 |
7.32 % |
| Polyvinyl Chloride |
2-16 |
92.34 % |
Finished Water Storage Capacity does not include a 3.0 million gallon clearwell at the water treatment plant, because this is a chlorine contact chamber for Free Chlorine Contact Time (CT) and it's effluent still needs additional treatment.
Installed 2158 new meters & Replaced 5 meters. Programs
Hydrants and Blow-offs are worked and flushed by HRW Water Quality Technician Staff with emphasis on dead ends, low usage areas and areas they have on a monthly, bi-monthly or quarterly flush schedule. Each Fire District also inspects, test and flush hydrants for insurance rating and maintaining availability in fire suppression emergencies. Hydrant issues are reported by Fire Departments to Harnett Regional Water for repairs.
Harnett Regional Water has completed it's system wide water meter change over to AMI water meters. Water Conservation
Interconnections and agreements with surrounding water systems will provide limited supply to our water distribution system due to the large Harnett Regional Water System coverage area which contains 1554.72 miles of distribution pipe lines. This area covers all of Harnett County except the Town of Dunn. We also supply to Consecutive Water Systems outside of Harnett County, these include Fort Bragg Military Base, Holly Springs, Fuquay-Varina, Spring Lake, Johnston County Water System & East Moore District. 2. Water Use Information
Service Area
| Sub-Basin(s) | % of Service Population |
|---|
| Cape Fear River (02-3) | 85 % |
| South River (02-4) | 15 % |
|
| County(s) | % of Service Population |
|---|
| Harnett | 89 % |
| Cumberland | 8 % |
| Wake | 3 % |
|
Population served is taken from the 2025 Permit to Operate a Community Public Water System License issued at the beginning of 2025 Year. Total connections from Administrations Updated request for April 17, 2024 Annual Sanitary Water Survey used for calculation of year round population for permit.
2024 System map uploaded. Water Use by Type
| Type of Use |
Metered
Connections |
Metered
Average Use (MGD) |
Non-Metered
Connections |
Non-Metered
Estimated Use (MGD) |
| Residential |
45,840 |
6.1699 |
0 |
0.0000 |
| Commercial |
867 |
0.5638 |
0 |
0.0000 |
| Industrial |
13 |
0.0189 |
0 |
0.0000 |
| Institutional |
37 |
0.1347 |
0 |
0.0000 |
How much water was used for system processes (backwash, line cleaning, flushing, etc.)? 1.1899 MGD
How System Process Daily Average is calculated = NPDES metering outfall is a total of the filter backwashing, filter to waste, GAC filter washes if on-line and Pulsators sludge blowdown decanting ~ Combined Daily Average = 1.0131 + Plant Process daily average = 0.0466 + Distribution Flushing daily average = 0.01767 + PAC tower makeup water metering daily average = 0.0024 + Polymer carrying water (Process & Sludge) daily average 0.0230 + Liquid sludge transfer to North Harnett Regional WWTP for centrifuging daily average = 0.0871
System Process Daily Average = 1.18987 MGD ~ 1.1899 MGD Water Sales
| Purchaser |
PWSID |
Average
Daily Sold
(MGD) |
Days
Used |
Contract |
Required to
comply with water
use restrictions? |
Pipe Size(s)
(Inches) |
Use
Type |
| MGD |
Expiration |
Recurring |
| Angier |
03-43-015 |
0.8602 |
365 |
1.4400 |
2059 |
Yes |
Yes |
16 |
Regular |
| Bragg Comm./NTA Water System |
50-43-001 |
0.2276 |
365 |
0.8000 |
2053 |
Yes |
Yes |
16 |
Regular |
| Campbell University |
03-43-030 |
0.0643 |
365 |
0.2500 |
2013 |
Yes |
Yes |
20 |
Regular |
| Coats |
03-43-020 |
0.1612 |
365 |
0.3000 |
2017 |
Yes |
Yes |
12 |
Regular |
| Dunn |
03-43-010 |
0.0000 |
0 |
0.2500 |
|
Yes |
No |
12 |
Emergency |
| East Moore Water District |
50-63-011 |
1.6514 |
365 |
3.0000 |
2042 |
Yes |
Yes |
16 |
Regular |
| Fort Bragg Water System |
50-26-019 |
2.9932 |
183 |
4.0000 |
2046 |
Yes |
Yes |
24 |
Regular |
| Fuquay Varina |
03-92-055 |
1.9217 |
365 |
4.0000 |
2032 |
Yes |
Yes |
12&36 |
Regular |
| Holly Springs |
03-92-050 |
3.6149 |
365 |
10.0000 |
2048 |
Yes |
Yes |
36 |
Regular |
| Johnston County |
03-51-070 |
1.2687 |
365 |
2.5000 |
2056 |
Yes |
Yes |
12&12 |
Regular |
| Lillington |
03-43-025 |
0.4268 |
365 |
2.0000 |
2017 |
Yes |
Yes |
16 |
Regular |
| Linden |
03-26-045 |
0.1524 |
365 |
0.2500 |
2031 |
Yes |
Yes |
6 |
Regular |
| Spring Lake |
03-26-020 |
0.3295 |
365 |
0.5000 |
2006 |
Yes |
Yes |
8 |
Regular |
| Woodlake |
03-63-114 |
0.1645 |
365 |
0.1400 |
1999 |
Yes |
Yes |
6 |
Regular |
We supply Fort Bragg on an alternating arrangement with Public Works Commission (PWC), thus the 183 days used. Fort Bragg yearly average 1.4966 x 2 = 2.9932 MGD to represent the daily demand supplied every day that we pump to them.
The capacity Holly Springs has purchased in the WTP is 10 MGD.
The contract is for either facility (Harnett or PWC) to be able to supply 8.0 MGD for a 24-hour period to the Old North Utility Services water system (50-26-019). However, Harnett Regional Water normally sells less than 4.0 MGD on an annual average basis.
3. Water Supply Sources
Monthly Withdrawals & Purchases
|
Average Daily
Use (MGD) |
Max Day
Use (MGD) |
|
Average Daily
Use (MGD) |
Max Day
Use (MGD) |
|
Average Daily
Use (MGD) |
Max Day
Use (MGD) |
| Jan |
20.7549 |
23.7819 |
May |
22.7399 |
27.5519 |
Sep |
23.6209 |
26.5119 |
| Feb |
20.0939 |
22.0719 |
Jun |
29.1729 |
35.2219 |
Oct |
24.1339 |
26.1419 |
| Mar |
20.6249 |
22.2519 |
Jul |
25.3329 |
32.0419 |
Nov |
22.0369 |
25.0919 |
| Apr |
22.8529 |
28.2419 |
Aug |
24.7289 |
29.4719 |
Dec |
22.5539 |
25.7919 |
Average Daily and Maximum Day includes the Dunn average purchase of 0.0519 MGD added to the Water Treatment Plants daily average and maximum day.
2024 Water withdrawal average = 23,236,054.79 gallons ~ 23.236 MGD 
Surface Water Sources
| Stream |
Reservoir |
Average Daily Withdrawal |
Maximum Day
Withdrawal (MGD) |
Available Raw
Water Supply |
Usable On-Stream
Raw Water Supply
Storage (MG) |
| MGD |
Days Used |
MGD |
* Qualifier |
| Cape Fear River |
Harnett County WTP Reservoir |
23.2360 |
365 |
35.1700 |
42.0000 |
T |
61.0000 |
* Qualifier: C=Contract Amount, SY20=20-year Safe Yield, SY50=50-year Safe Yield, F=20% of 7Q10 or other instream flow requirement, CUA=Capacity Use Area Permit
Surface Water Sources (continued)
| Stream |
Reservoir |
Drainage Area
(sq mi) |
Metered? |
Sub-Basin |
County |
Year
Offline |
Use
Type |
| Cape Fear River |
Harnett County WTP Reservoir |
3,464 |
Yes |
Cape Fear River (02-3) |
Harnett |
|
Regular |
Cape Fear River average daily withdrawal is the 2024 - 12 month WIMS Annual Local Water Supply Flow Report using Monthly Total Raw MGD Treated, which is the East & West Pulsator Train flow meters.
2024 annual withdrawal average is 8,481,160,000 gallons / 365 day per year =23,236,054.79 ~ 23.236 MGD.
2024 annual withdrawal average with purchases is 8,481,160,000 WTP + 18,943,500 Dunn = 8,500,103,500 gallons / 365 days per yr. =23,287,954
~23.288 MGD.
The USGS low flow analysis for the Sanford WTP expansion project annual 7Q10 flow at Lillington river gauge is 288 CFS.
This low flow study is for 2007 to 2022. For 20% for 7Q10 ~ 288 cubic feet sec ÷ 1.5472 gal. /sec conversion to MG = 186.1427 MG and then 20% of
186.1427 MG = 37.228 MGD.
Harnett County Regional WTP production rating is 42.000 MGD. Water Purchases From Other Systems
| Seller |
PWSID |
Average
Daily Purchased
(MGD) |
Days
Used |
Contract |
Required to
comply with water
use restrictions? |
Pipe Size(s)
(Inches) |
Use
Type |
| MGD |
Expiration |
Recurring |
| Apex |
03-92-045 |
0.0000 |
0 |
0.0000 |
|
|
Yes |
12 |
Emergency |
| Cary |
03-92-020 |
0.0000 |
0 |
0.0000 |
|
|
Yes |
12 |
Emergency |
| Dunn |
03-43-010 |
0.0519 |
365 |
1.0000 |
2050 |
Yes |
Yes |
16 |
Regular |
| Fuquay Varina |
03-92-055 |
0.0000 |
0 |
1.3000 |
2029 |
Yes |
Yes |
12 |
Emergency |
| Holly Springs |
03-92-050 |
0.0000 |
0 |
1.0000 |
2041 |
Yes |
Yes |
12 |
Emergency |
| Johnston County |
03-51-070 |
0.0000 |
0 |
3.9000 |
|
Yes |
Yes |
12 |
Emergency |
| Raleigh |
03-92-010 |
0.0000 |
0 |
2.0000 |
|
Yes |
Yes |
12 |
Emergency |
| Smithfield |
03-51-010 |
0.0000 |
0 |
0.0000 |
|
Yes |
Yes |
12 |
Emergency |
Dunn Water System 03-43-010 is the only system that we purchase water from daily. This purchase is to an isolated section of our distribution system. Water Treatment Plants
| Plant Name |
Permitted Capacity
(MGD) |
Is Raw Water Metered? |
Is Finished Water Ouput Metered? |
Source |
| Harnett County Regional WTP |
42.0000 |
Yes |
Yes |
Cape Fear River |
Permitted WTP Capacity is 42.000 MGD. 80% WTP Capacity = 33.800 MGD & 90% WTP Capacity = 37.800 MGD
Maximum Day Demand 2024 was 35.2219 MGD on June 29th = HCRWTP (35.170) + Dunn purchase (0.0519)
High 5 Day Average at WTP - June 21st to 25th was 33.202 MGD (34.770 + 34.440 + 32.810 +32.130 + 31.860) 4. Wastewater Information
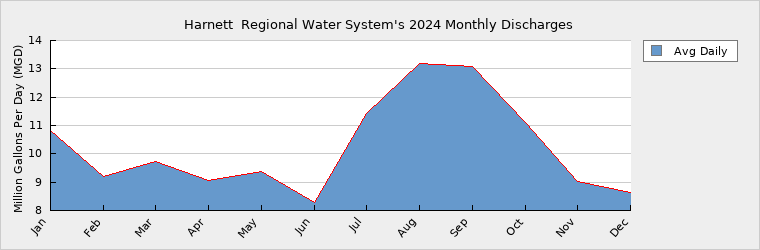
Monthly Discharges
|
Average Daily
Discharge (MGD) |
|
Average Daily
Discharge (MGD) |
|
Average Daily
Discharge (MGD) |
| Jan |
11.8577 |
May |
10.2055 |
Sep |
14.1200 |
| Feb |
10.2743 |
Jun |
9.4158 |
Oct |
12.1657 |
| Mar |
10.7101 |
Jul |
12.5761 |
Nov |
9.8843 |
| Apr |
10.0249 |
Aug |
14.0987 |
Dec |
9.8938 |
North Harnett Regional Wastewater Treatment Plant (NHRWWTP) is currently expanding from 7.500 MGD to 16.500 MGD. Notice to Proceed issued March 18, 2024. NHRWWTP Construction is well under way. Wastewater Permits
| Permit Number |
Type |
Permitted Capacity
(MGD) |
Design Capacity
(MGD) |
Average Annual
Daily Discharge
(MGD) |
Maximum Day Discharge
(MGD) |
Receiving Stream |
Receiving Basin |
| NC0007684 |
WTP |
42.0000 |
42.0000 |
1.0116 |
1.7980 |
Cape Fear River |
Cape Fear River (02-3) |
| NC0021636 |
WWTP |
7.5000 |
7.5000 |
5.1130 |
19.0380 |
Cape Fear River |
Cape Fear River (02-3) |
| NC0088366 |
WWTP |
15.0000 |
15.0000 |
5.1444 |
9.1340 |
Lower Little River |
Cape Fear River (02-3) |
Wastewater Interconnections
| Water System |
PWSID |
Type |
Average Daily Amount |
Contract
Maximum (MGD) |
| MGD |
Days Used |
| Angier |
03-43-015 |
Receiving |
0.8602 |
365 |
1.0800 |
| Fort Liberty Water System |
50-26-019 |
Receiving |
3.5293 |
365 |
10.0000 |
| Fuquay-Varina |
03-92-055 |
Receiving |
1.7365 |
365 |
2.6000 |
| Liberty Comm./NTA Water System |
50-43-001 |
Receiving |
0.2427 |
365 |
0.8000 |
| Lillington |
03-43-025 |
Receiving |
0.8220 |
365 |
1.2000 |
12th year receiving Wastewater discharge from Fort Liberty (Bragg) Water System. This flow is treated by the South Harnett Regional WWTP. 5. Planning
Projections
| |
2024 |
2030 |
2040 |
2050 |
2060 |
2070 |
| Year-Round Population |
111,655 |
126,726 |
145,262 |
163,490 |
181,709 |
200,422 |
| Seasonal Population |
0 |
0 |
0 |
0 |
0 |
0 |
| |
| Residential |
6.1699 |
6.9699 |
7.9894 |
8.9919 |
9.9939 |
11.0232 |
| Commercial |
0.5638 |
0.6732 |
0.9047 |
1.2159 |
1.6340 |
2.1960 |
| Industrial |
0.0189 |
0.0213 |
0.0595 |
0.0316 |
0.0386 |
0.0470 |
| Institutional |
0.1347 |
0.1517 |
0.1849 |
0.2254 |
0.2748 |
0.3349 |
| System Process |
1.1899 |
1.2631 |
1.3953 |
1.5412 |
1.7025 |
1.8806 |
| Unaccounted-for |
2.8369 |
3.2188 |
3.7345 |
4.2565 |
4.8371 |
5.4887 |
Population Served - Used NC State Office of Budget and Management Harnett County projects at 80% since we do not supply Dunn.
Residential - Used 55 gallon per day per capita times the Population served number.
Commercial - used 3% growth, Industrial - used 2% growth, Institutional - used 2% growth & System Process - used 1% growth.
Formula used = Present Value ( 1+ %growth)exponent number of years Future Water Sales
| Purchaser |
PWSID |
Contract |
Pipe Size(s) (Inches) |
Use Type |
| MGD |
Year Begin |
Year End |
| Town of Angier |
03-43-015 |
1.5600 |
2030 |
|
16 |
Regular |
Harnett Regional Water has been in discussions with the Town of Angier to increase contract amount from 1.44 MGD to 3.00 MGD (+1.56 MGD), but no
actions have taken place to date. Future Supply Sources
| Source Name |
PWSID |
Source Type |
Additional Supply |
Year Online |
Year Offline |
Type |
| Cape Fear River |
00-00-000 |
Surface |
12.0000 |
2030 |
|
Regular |
Future development of a new Water Treatment Plant near the old Swift Industry Plant's raw intake in the Town of Erwin. Harnett Regional Water gained ownership when we purchased the Erwin Water System. This will help the water supply for the far reaches of the Metro Water District and Johnston County Water System. The Metro Water District is becoming an extreme challenge to meet the demands during the summer months. We feed into Johnston County's Water System thru our main master meter vaults. The main Meter Vaults are at 210/Old Stage Road that feeds Johnston County's Water Tower at McGee's Crossroads (intersection of Highway 210 and 50) and the meter vault that feeds into the Town of Benson Area (Hwy 27 & Johnston County Line). Demand v/s Percent of Supply
| |
2024 |
2030 |
2040 |
2050 |
2060 |
2070 |
| Surface Water Supply |
42.0000 |
42.0000 |
42.0000 |
42.0000 |
42.0000 |
42.0000 |
| Ground Water Supply |
0.0000 |
0.0000 |
0.0000 |
0.0000 |
0.0000 |
0.0000 |
| Purchases |
1.0000 |
1.0000 |
1.0000 |
1.0000 |
1.0000 |
1.0000 |
| Future Supplies |
12.0000 |
12.0000 |
12.0000 |
12.0000 |
12.0000 |
| Total Available Supply (MGD) |
43.0000 |
55.0000 |
55.0000 |
55.0000 |
55.0000 |
55.0000 |
| Service Area Demand |
10.9141 |
12.2980 |
14.2683 |
16.2625 |
18.4809 |
20.9704 |
| Sales |
12.3102 |
29.2045 |
29.2045 |
29.2045 |
29.2045 |
29.2045 |
| Future Sales |
1.5600 |
1.5600 |
1.5600 |
1.5600 |
1.5600 |
| Total Demand (MGD) |
23.2243 |
43.0625 |
45.0328 |
47.0270 |
49.2454 |
51.7349 |
| Demand as Percent of Supply |
54% |
78% |
82% |
86% |
90% |
94% |

The purpose of the above chart is to show a general indication of how the long-term per capita water demand changes over time. The per capita water demand may actually be different than indicated due to seasonal populations and the accuracy of data submitted. Water systems that have calculated long-term per capita water demand based on a methodology that produces different results may submit their information in the notes field.
Your long-term water demand is 55 gallons per capita per day. What demand management practices do you plan to implement to reduce the per capita water demand (i.e. conduct regular water audits, implement a plumbing retrofit program, employ practices such as rainwater harvesting or reclaimed water)? If these practices are covered elsewhere in your plan, indicate where the practices are discussed here.
Harnett Regional Water (HRW) has completed it's conversion to Automatic Meter Reading (AMR) system for the distribution customers. This should allow HRW and customers themselves to monitor / be contacted for high water usage due to customer side of meter leaks, running toilets etc.
Are there other demand management practices you will implement to reduce your future supply needs? Future conservation could be the implementation of an active Water Conservation Public Education Program.
What supplies other than the ones listed in future supplies are being considered to meet your future supply needs? A possibility for the future to supply the southern and Fort Liberty(Bragg) part of the Harnett Regional Water grid is to build a water treatment facility on the Upper or Lower Little River.
How does the water system intend to implement the demand management and supply planning components above? Harnett Regional Water did a hydraulic water model of our water system 5 plus years ago. We are planning to contract again with Hazen and Sawyer to
update the hydraulic model of distribution system and use it as a driver for future planning.
Additional Information
Has this system participated in regional water supply or water use planning? Yes, Harnett Regional Water is a member of the Triangle Water Supply Partnership.
What major water supply reports or studies were used for planning? Have had an engineering firm complete a hydraulic model on our distribution system. That was about 5 or more years ago and are planning to get an updated hydraulic model completed to reflect the great influx of new housing developments over the last several years. The current hydraulic model did show some areas that needed improvements to meet future demands. The engineering firm has master planned the needed upgrades and projected cost. We have incorporated a few of the easily implemented / low cost recommendations and there are others that are expensive and will need future planning and capital forecasting.
Please describe any other needs or issues regarding your water supply sources, any water system deficiencies or needed improvements (storage, treatment, etc.) or your ability to meet present and future water needs. Include both quantity and quality considerations, as well as financial, technical, managerial, permitting, and compliance issues: The next area of the distribution system that need planning to meet future supply is the North Finished Distribution Section - also called Metro District. The Metro District also supplies parts of Johnston County Water System and is getting harder to pump the water out fast enough and thru our tanks and booster stations to meet our and their demands, especially in the summer months. The long range plan is the construction of a water plant in Erwin as mentioned earlier in this report to supply this area in the county and Johnston County Water System. The other concern is the Northwest District, which is experiencing very rapid growth that needs upgrades to meet these future demands. Plans have been made to put an elevated tank and booster station halfway to the 5.3 MGD ground storage tank in Wake County. This increases the Wake County High Service pumping capacity at the water plant since it will decrease some of the 330 feet of head these pumps have to pump against. Harnett Regional Water is also in planning stages to add a second elevated tank in the Northwest District. Finally overall Harnett County is experiencing rapid growth and many subdivisions are in the execution stage of development and will require continues planning to meet these needs.
The Division of Water Resources (DWR) provides the data contained within this
Local Water Supply Plan (LWSP) as a courtesy and service to our customers.
DWR staff does not field verify data. Neither DWR, nor any other party
involved in the preparation of this LWSP attests that the data is completely
free of errors and omissions. Furthermore, data users are cautioned that
LWSPs labeled PROVISIONAL have yet to be reviewed by DWR staff. Subsequent
review may result in significant revision. Questions regarding the accuracy
or limitations of usage of this data should be directed to the water system
and/or DWR.
|