|
The Division of Water Resources (DWR) provides the data contained within this
Local Water Supply Plan (LWSP) as a courtesy and service to our customers.
DWR staff does not field verify data. Neither DWR, nor any other party
involved in the preparation of this LWSP attests that the data is completely
free of errors and omissions. Furthermore, data users are cautioned that
LWSPs labeled PROVISIONAL have yet to be reviewed by DWR staff. Subsequent
review may result in significant revision. Questions regarding the accuracy
or limitations of usage of this data should be directed to the water system
and/or DWR.
1. System Information
Contact Information
Complete
| Water System Name: |
Clayton |
|
PWSID: |
03-51-020 |
| Mailing Address: | P.O. Box 879
Clayton, NC 27528 | Ownership: | Municipality |
| |
| Contact Person: | Travis Jessup | Title: | Water Resources Director |
| Phone: | 919-427-1290 | Cell/Mobile: | 919-553-1530 |
| |
| Secondary Contact: | Rich Cappola | | Phone: | 919-359-1288 |
| Mailing Address: | P.O. Box 879
Clayton, NC 27528 | Cell/Mobile: | 919-553-1530 |
Distribution System
| Line Type |
Size Range (Inches) |
Estimated % of lines |
| Asbestos Cement |
4-16 |
7.07 % |
| Cast Iron |
6-10 |
3.67 % |
| Ductile Iron |
2-16 |
12.41 % |
| Galvanized Iron |
3/4-6 |
0.73 % |
| Other |
2-12 |
0.70 % |
| Polyvinyl Chloride |
2-12 |
75.42 % |
A 1,000,000 gallon tank is planned and is expected to be online in 2026. Clayton has purchased an additional 230,000 gallons of storage form Johnston County until 2029. We also have a 500,000 gallon ground storage tank with partial certification. Programs
Water Conservation
2. Water Use Information
Service Area
| Sub-Basin(s) | % of Service Population |
|---|
| Neuse River (10-1) | 100 % |
|
| County(s) | % of Service Population |
|---|
| Johnston | 100 % |
|
Population includes customer in Clayton PWSID 03-51-020 and Clayton North PWSID 40-51-019 Water Use by Type
| Type of Use |
Metered
Connections |
Metered
Average Use (MGD) |
Non-Metered
Connections |
Non-Metered
Estimated Use (MGD) |
| Residential |
15,442 |
1.5113 |
0 |
0.0000 |
| Commercial |
688 |
0.3243 |
0 |
0.0000 |
| Industrial |
18 |
1.7561 |
0 |
0.0000 |
| Institutional |
139 |
0.0977 |
0 |
0.0000 |
How much water was used for system processes (backwash, line cleaning, flushing, etc.)? 0.0300 MGD
Clayton and Clayton North added together 3. Water Supply Sources
Monthly Withdrawals & Purchases
|
Average Daily
Use (MGD) |
Max Day
Use (MGD) |
|
Average Daily
Use (MGD) |
Max Day
Use (MGD) |
|
Average Daily
Use (MGD) |
Max Day
Use (MGD) |
| Jan |
3.2190 |
3.8800 |
May |
4.4810 |
4.8820 |
Sep |
3.3320 |
4.5490 |
| Feb |
4.5450 |
3.8570 |
Jun |
4.3310 |
5.1240 |
Oct |
4.3590 |
4.1650 |
| Mar |
3.3590 |
3.9350 |
Jul |
4.0950 |
6.1650 |
Nov |
3.8360 |
4.4230 |
| Apr |
3.4790 |
4.1090 |
Aug |
5.0020 |
4.6680 |
Dec |
3.1690 |
3.9400 |
The average monthly values are not calculated from the same metered information as the purchases from Johnston County. Purchases from Johnston County are calculated based on weekly reads from the County interconnects and monthly utilization is calculated based on billed amounts.
It should be noted that Johnston County billing cycles/dates do not correspond 1:1 with months, 
Water Purchases From Other Systems
| Seller |
PWSID |
Average
Daily Purchased
(MGD) |
Days
Used |
Contract |
Required to
comply with water
use restrictions? |
Pipe Size(s)
(Inches) |
Use
Type |
| MGD |
Expiration |
Recurring |
| Johnston County Utilities |
03-51-070 |
3.9430 |
366 |
6.1000 |
2025 |
Yes |
Yes |
20 |
Regular |
4. Wastewater Information
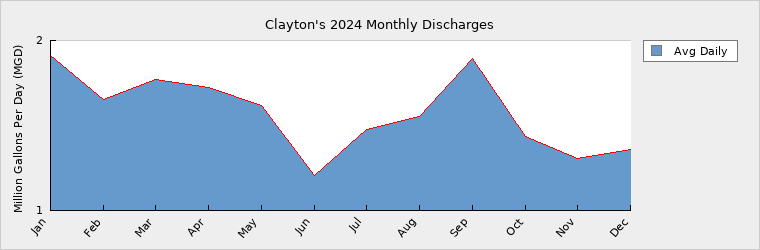
Monthly Discharges
|
Average Daily
Discharge (MGD) |
|
Average Daily
Discharge (MGD) |
|
Average Daily
Discharge (MGD) |
| Jan |
3.5000 |
May |
3.2120 |
Sep |
3.8680 |
| Feb |
3.2580 |
Jun |
2.8640 |
Oct |
3.3650 |
| Mar |
3.2570 |
Jul |
3.3520 |
Nov |
3.2110 |
| Apr |
3.2500 |
Aug |
3.5460 |
Dec |
3.4180 |
Wastewater Permits
| Permit Number |
Type |
Permitted Capacity
(MGD) |
Design Capacity
(MGD) |
Average Annual
Daily Discharge
(MGD) |
Maximum Day Discharge
(MGD) |
Receiving Stream |
Receiving Basin |
| NC0025453 |
WWTP |
2.5000 |
2.5000 |
1.5600 |
4.2310 |
Neuse River |
Neuse River (10-1) |
Wastewater Interconnections
| Water System |
PWSID |
Type |
Average Daily Amount |
Contract
Maximum (MGD) |
| MGD |
Days Used |
| City of Raleigh |
03-92-010 |
Discharging |
0.4540 |
366 |
1.7500 |
| Johnston County Utilities |
03-51-070 |
Discharging |
1.3320 |
366 |
1.4000 |
5. Planning
Projections
| |
2024 |
2030 |
2040 |
2050 |
2060 |
2070 |
| Year-Round Population |
35,169 |
41,844 |
52,969 |
64,094 |
75,219 |
86,344 |
| Seasonal Population |
0 |
0 |
0 |
0 |
0 |
0 |
| |
| Residential |
1.5113 |
2.0687 |
2.6922 |
3.3160 |
3.9390 |
4.5627 |
| Commercial |
0.3243 |
0.4341 |
0.5570 |
0.6801 |
0.8030 |
0.9259 |
| Industrial |
1.7561 |
3.1850 |
5.2728 |
5.5274 |
5.5274 |
5.5274 |
| Institutional |
0.0977 |
0.1310 |
0.1681 |
0.2053 |
0.2423 |
0.2794 |
| System Process |
0.0300 |
0.0320 |
0.0340 |
0.0360 |
0.0380 |
0.0400 |
| Unaccounted-for |
0.2236 |
0.8124 |
1.2132 |
1.5376 |
1.6794 |
1.8211 |
The projected demand figures reported are sourced from an HDR (third-party) water demand forecasting study. Future Supply Sources
| Source Name |
PWSID |
Source Type |
Additional Supply |
Year Online |
Year Offline |
Type |
| Johnston County West |
03-51-070 |
Purchase |
2.4000 |
2030 |
|
Regular |
| Johnston County West |
03-51-070 |
Purchase |
4.0000 |
2040 |
|
Regular |
| Johnston County West |
03-51-070 |
Purchase |
3.5000 |
2050 |
|
Regular |
| Johnston County West |
03-51-070 |
Purchase |
1.5000 |
2060 |
|
Regular |
| Johnston County West |
03-51-070 |
Purchase |
1.5000 |
2070 |
|
Regular |
Stair stepping purchases from Johnston County. Demand v/s Percent of Supply
| |
2024 |
2030 |
2040 |
2050 |
2060 |
2070 |
| Surface Water Supply |
0.0000 |
0.0000 |
0.0000 |
0.0000 |
0.0000 |
0.0000 |
| Ground Water Supply |
0.0000 |
0.0000 |
0.0000 |
0.0000 |
0.0000 |
0.0000 |
| Purchases |
6.1000 |
6.1000 |
6.1000 |
6.1000 |
6.1000 |
6.1000 |
| Future Supplies |
2.4000 |
6.4000 |
9.9000 |
11.4000 |
12.9000 |
| Total Available Supply (MGD) |
6.1000 |
8.5000 |
12.5000 |
16.0000 |
17.5000 |
19.0000 |
| Service Area Demand |
3.9430 |
6.6632 |
9.9373 |
11.3024 |
12.2291 |
13.1565 |
| Sales |
0.0000 |
0.0000 |
0.0000 |
0.0000 |
0.0000 |
0.0000 |
| Future Sales |
0.0000 |
0.0000 |
0.0000 |
0.0000 |
0.0000 |
| Total Demand (MGD) |
3.9430 |
6.6632 |
9.9373 |
11.3024 |
12.2291 |
13.1565 |
| Demand as Percent of Supply |
65% |
78% |
79% |
71% |
70% |
69% |

The purpose of the above chart is to show a general indication of how the long-term per capita water demand changes over time. The per capita water demand may actually be different than indicated due to seasonal populations and the accuracy of data submitted. Water systems that have calculated long-term per capita water demand based on a methodology that produces different results may submit their information in the notes field.
Your long-term water demand is 43 gallons per capita per day. What demand management practices do you plan to implement to reduce the per capita water demand (i.e. conduct regular water audits, implement a plumbing retrofit program, employ practices such as rainwater harvesting or reclaimed water)? If these practices are covered elsewhere in your plan, indicate where the practices are discussed here.
No Changes
Are there other demand management practices you will implement to reduce your future supply needs? Improved and systematic flushing for targeting specific areas and reducing non-revenue water usage. Enhanced CIP to replace older water lines to effectively reduce water loss.
What supplies other than the ones listed in future supplies are being considered to meet your future supply needs? Developing a new water intake from Neuse River and additional utility partnerships.
How does the water system intend to implement the demand management and supply planning components above? Continued work with consultants to evaluate supply options and implement new water distribution model for more effective management of the system and flushing operations.
Additional Information
Has this system participated in regional water supply or water use planning? Yes, Yes, the Town of Clayton is a member of Triangle Water Supply Partnership and has been a part of regionalization studies.
What major water supply reports or studies were used for planning? NC Hwy 401 Corridor Study and Updated regional forecasts through Triangle Water Supply Partnership
Please describe any other needs or issues regarding your water supply sources, any water system deficiencies or needed improvements (storage, treatment, etc.) or your ability to meet present and future water needs. Include both quantity and quality considerations, as well as financial, technical, managerial, permitting, and compliance issues: Additional storage will be required and is planned to meet half average day demand requirements.
The Division of Water Resources (DWR) provides the data contained within this
Local Water Supply Plan (LWSP) as a courtesy and service to our customers.
DWR staff does not field verify data. Neither DWR, nor any other party
involved in the preparation of this LWSP attests that the data is completely
free of errors and omissions. Furthermore, data users are cautioned that
LWSPs labeled PROVISIONAL have yet to be reviewed by DWR staff. Subsequent
review may result in significant revision. Questions regarding the accuracy
or limitations of usage of this data should be directed to the water system
and/or DWR.
|