|
The Division of Water Resources (DWR) provides the data contained within this
Local Water Supply Plan (LWSP) as a courtesy and service to our customers.
DWR staff does not field verify data. Neither DWR, nor any other party
involved in the preparation of this LWSP attests that the data is completely
free of errors and omissions. Furthermore, data users are cautioned that
LWSPs labeled PROVISIONAL have yet to be reviewed by DWR staff. Subsequent
review may result in significant revision. Questions regarding the accuracy
or limitations of usage of this data should be directed to the water system
and/or DWR.
1. System Information
Contact Information
Complete
| Water System Name: |
Benson |
|
PWSID: |
03-51-025 |
| Mailing Address: | P.O. Box 69
Benson, NC 27504 | Ownership: | Municipality |
| |
| Contact Person: | D. Ray Adams | Title: | Utility Compliance Supervisor/ORC |
| Phone: | 919-894-3553 | Cell/Mobile: | 919-820-1453 |
| |
| Secondary Contact: | Kimberly Pickett | | Phone: | 919-894-3553 |
| Mailing Address: | PO Box 69
Benson, NC 27504 | Cell/Mobile: | 919-820-1453 |
Distribution System
| Line Type |
Size Range (Inches) |
Estimated % of lines |
| Asbestos Cement |
6-16 |
11.50 % |
| Cast Iron |
6-10 |
15.90 % |
| Ductile Iron |
6-16 |
12.60 % |
| Galvanized Iron |
2 |
4.00 % |
| Polyvinyl Chloride |
2-12 |
56.00 % |
We have a contract with the City of Dunn allocating 0.200 MGD of additional water storage capacity per day for Benson's water system. We are currently in the planning phase of adding a new 750,000 gallon water tower that will be used in conjunction with our existing 300,000 gallon tower. Our existing tower was completely refurbished in 2024. Programs
We utilize our AMI system to flag potential leaks when a customer's water use is in excess of their average hourly usage. Also, we occasionally call upon the NC Rural Water Association to conduct leak detection surveys. The public works staff are instructed to monitor for potential water leaks as they are out completing their daily routine assignments. Benson's unaccounted for water loss percentage is routinely updated and utilized to assess potential water leaks. Water Conservation
2. Water Use Information
Service Area
| Sub-Basin(s) | % of Service Population |
|---|
| Cape Fear River (02-3) | 88 % |
| Neuse River (10-1) | 12 % |
|
| County(s) | % of Service Population |
|---|
| Johnston | 100 % |
|
Water Use by Type
| Type of Use |
Metered
Connections |
Metered
Average Use (MGD) |
Non-Metered
Connections |
Non-Metered
Estimated Use (MGD) |
| Residential |
1,743 |
0.2070 |
45 |
0.0000 |
| Commercial |
323 |
0.1290 |
0 |
0.0000 |
| Industrial |
5 |
0.3500 |
0 |
0.0000 |
| Institutional |
11 |
0.0110 |
0 |
0.0000 |
How much water was used for system processes (backwash, line cleaning, flushing, etc.)? 0.0710 MGD
Water Sales
| Purchaser |
PWSID |
Average
Daily Sold
(MGD) |
Days
Used |
Contract |
Required to
comply with water
use restrictions? |
Pipe Size(s)
(Inches) |
Use
Type |
| MGD |
Expiration |
Recurring |
| Johnston County |
03-51-070 |
0.0020 |
366 |
0.0100 |
2026 |
Yes |
Yes |
12 |
Regular |
3. Water Supply Sources
Monthly Withdrawals & Purchases
|
Average Daily
Use (MGD) |
Max Day
Use (MGD) |
|
Average Daily
Use (MGD) |
Max Day
Use (MGD) |
|
Average Daily
Use (MGD) |
Max Day
Use (MGD) |
| Jan |
0.6820 |
0.7770 |
May |
0.8290 |
0.9890 |
Sep |
0.8810 |
0.9690 |
| Feb |
0.7610 |
0.9730 |
Jun |
0.9250 |
1.0340 |
Oct |
0.8670 |
1.0350 |
| Mar |
0.7420 |
1.0130 |
Jul |
0.8940 |
1.0200 |
Nov |
0.8300 |
0.9390 |
| Apr |
0.8120 |
0.9940 |
Aug |
0.9050 |
1.1580 |
Dec |
0.8190 |
0.9880 |

Water Purchases From Other Systems
| Seller |
PWSID |
Average
Daily Purchased
(MGD) |
Days
Used |
Contract |
Required to
comply with water
use restrictions? |
Pipe Size(s)
(Inches) |
Use
Type |
| MGD |
Expiration |
Recurring |
| Dunn |
03-43-010 |
0.7060 |
366 |
1.2000 |
2027 |
Yes |
Yes |
16 |
Regular |
| Johnston County |
03-51-070 |
0.1220 |
366 |
|
2026 |
Yes |
Yes |
12,16 |
Regular |
We do not have a minimum or maximum purchase requirement with the county. Per their request, we provide them with projections for our anticipated future needs so they can ensure that continuous service is provided. 0.09 MGD is the capacity that Benson owns in the Johnston County system. 4. Wastewater Information
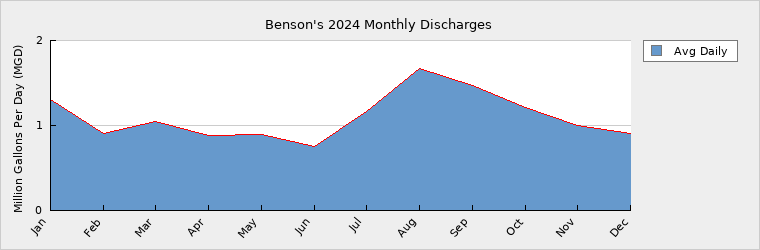
Monthly Discharges
|
Average Daily
Discharge (MGD) |
|
Average Daily
Discharge (MGD) |
|
Average Daily
Discharge (MGD) |
| Jan |
1.3085 |
May |
0.8908 |
Sep |
1.4750 |
| Feb |
0.9079 |
Jun |
0.7580 |
Oct |
1.2125 |
| Mar |
1.0460 |
Jul |
1.1647 |
Nov |
0.9968 |
| Apr |
0.8868 |
Aug |
1.6666 |
Dec |
0.9090 |
Benson has plans to expand the wastewater treatment facility pending an approved discharge location to be determined by the state. An environmental survey of Hannah Creek is currently being conducted to gather data needed for a hydraulic model update. The calibrated model will be utilized to run simulations that will hopefully identify an acceptable discharge location, subsequently allowing Benson to move forward with the plant expansion. Wastewater Permits
| Permit Number |
Type |
Permitted Capacity
(MGD) |
Design Capacity
(MGD) |
Average Annual
Daily Discharge
(MGD) |
Maximum Day Discharge
(MGD) |
Receiving Stream |
Receiving Basin |
| NC0020389 |
WWTP |
1.9000 |
2.1000 |
1.0900 |
|
Hannah Creek |
Neuse River (10-1) |
Wastewater Interconnections
| Water System |
PWSID |
Type |
Average Daily Amount |
Contract
Maximum (MGD) |
| MGD |
Days Used |
| Johnston County |
03-51-070 |
Receiving |
0.2450 |
366 |
|
The data shown above is also included in the average MGD numbers found in the "monthly discharge" tab 5. Planning
Projections
| |
2024 |
2030 |
2040 |
2050 |
2060 |
2070 |
| Year-Round Population |
4,293 |
5,357 |
6,157 |
6,957 |
7,757 |
8,557 |
| Seasonal Population |
0 |
0 |
0 |
0 |
0 |
0 |
| |
| Residential |
0.2070 |
0.2590 |
0.2990 |
0.3380 |
0.3780 |
0.4170 |
| Commercial |
0.1290 |
0.1410 |
0.1570 |
0.1730 |
0.1890 |
0.2050 |
| Industrial |
0.3500 |
0.9500 |
0.9500 |
0.9500 |
0.9500 |
0.9500 |
| Institutional |
0.0110 |
0.0150 |
0.0160 |
0.0170 |
0.0180 |
0.0190 |
| System Process |
0.0710 |
0.0660 |
0.0660 |
0.0600 |
0.0600 |
0.0500 |
| Unaccounted-for |
0.0580 |
0.0500 |
0.0450 |
0.0400 |
0.0350 |
0.0300 |
(ResCons) 25+140(1883) 26+100(1983) 27+32(2015) 28+32(2047) 29+32(2079) 30+32(2111) 40+320(2431) 50+320(2751) 60+320(3071) 70+320(3391)
(Com +4) 123Avdaypercon Res 405AvdayperconCom Future Supply Sources
| Source Name |
PWSID |
Source Type |
Additional Supply |
Year Online |
Year Offline |
Type |
| City of Dunn |
03-43-010 |
Purchase |
0.6500 |
2030 |
|
Regular |
| City of Dunn |
03-43-010 |
Purchase |
0.1500 |
2050 |
|
Regular |
We are currently in discussions with the City of Dunn regarding an increase in our purchase contract to meet future demand projections Demand v/s Percent of Supply
| |
2024 |
2030 |
2040 |
2050 |
2060 |
2070 |
| Surface Water Supply |
0.0000 |
0.0000 |
0.0000 |
0.0000 |
0.0000 |
0.0000 |
| Ground Water Supply |
0.0000 |
0.0000 |
0.0000 |
0.0000 |
0.0000 |
0.0000 |
| Purchases |
1.3220 |
1.3220 |
1.3220 |
1.3220 |
1.3220 |
1.3220 |
| Future Supplies |
0.6500 |
0.6500 |
0.8000 |
0.8000 |
0.8000 |
| Total Available Supply (MGD) |
1.3220 |
1.9720 |
1.9720 |
2.1220 |
2.1220 |
2.1220 |
| Service Area Demand |
0.8260 |
1.4810 |
1.5330 |
1.5780 |
1.6300 |
1.6710 |
| Sales |
0.0020 |
0.0100 |
0.0100 |
0.0100 |
0.0100 |
0.0100 |
| Future Sales |
0.0000 |
0.0000 |
0.0000 |
0.0000 |
0.0000 |
| Total Demand (MGD) |
0.8280 |
1.4910 |
1.5430 |
1.5880 |
1.6400 |
1.6810 |
| Demand as Percent of Supply |
63% |
76% |
78% |
75% |
77% |
79% |

The purpose of the above chart is to show a general indication of how the long-term per capita water demand changes over time. The per capita water demand may actually be different than indicated due to seasonal populations and the accuracy of data submitted. Water systems that have calculated long-term per capita water demand based on a methodology that produces different results may submit their information in the notes field.
Your long-term water demand is 48 gallons per capita per day. What demand management practices do you plan to implement to reduce the per capita water demand (i.e. conduct regular water audits, implement a plumbing retrofit program, employ practices such as rainwater harvesting or reclaimed water)? If these practices are covered elsewhere in your plan, indicate where the practices are discussed here.
As part of the EPA's new lead service line inventory requirement, we are currently identifying water service line pipe material and will continue to do so until all services have been identified. We have found that many of these service lines are galvanized and are at or near the end of their useful life. Due to their age and condition, these lines are routinely found leaking and are subsequently replaced. I anticipate that there are a large number of leaking galvanized lines still in service. During the ID process, those that we find leaking will be immediately replaced, and those not leaking will be replaced at the conclusion of the LSL inventory. I am confident that we will see an improvement in our per capita demand after all galvanized lines have been replaced, and by utilizing our leak detection program.
Are there other demand management practices you will implement to reduce your future supply needs? We are planning to analyze our water conservation ordinance and make improvements as needed. We also plan to better promote water conservation though a stronger public education campaign. We will be researching potential new technologies to incorporate into the program, and will also be engaging the NC Rural Water Association to assist.
What supplies other than the ones listed in future supplies are being considered to meet your future supply needs? As a purchase water system, we are mindful of the importance of securing additional sources for our future supply needs. We have already began discussions internally to explore additional options for redundancy, however we are actively working to improve the efficiency of our existing sources which will prolong the need to immediately acquire new ones. We are in the process of updating our water system hydraulic model to analyze various operational scenarios with the goal of improving source water efficiency and reducing per capita demand.
How does the water system intend to implement the demand management and supply planning components above? Most of the management and planning components described above are already funded, or have been approved for funding.
Additional Information
Has this system participated in regional water supply or water use planning? Yes, Our water system was included in separate water merger and regionalization feasibility studies that were conducted by each of our bulk water suppliers.
What major water supply reports or studies were used for planning? Current and previous monthly purchase reports, monthly sales reports, previous LWSPs, new service line installation records, asset management plans, engineering reports for new development, non-revenue water reports, unaccounted for water reports, bulk water purchase contracts, existing water conservation ordinances, hydraulic modeling assessment reports, booster pump performance data, and board meeting records indicating prioritization for industrial growth.
Please describe any other needs or issues regarding your water supply sources, any water system deficiencies or needed improvements (storage, treatment, etc.) or your ability to meet present and future water needs. Include both quantity and quality considerations, as well as financial, technical, managerial, permitting, and compliance issues: To help accommodate anticipated growth and meet future regulatory requirements, we are in the process of acquiring a 750,000 gallon water tower that we hope to have in service by the end of 2026. We have identified many of the water system improvements that will be needed to accommodate the additional capacity in our system. Funding requests for the needed improvements have been submitted and some are already approved. As a result of these and many other factors, we are confident to report that the financial, technical and managerial needs of our water system are being met.
The Division of Water Resources (DWR) provides the data contained within this
Local Water Supply Plan (LWSP) as a courtesy and service to our customers.
DWR staff does not field verify data. Neither DWR, nor any other party
involved in the preparation of this LWSP attests that the data is completely
free of errors and omissions. Furthermore, data users are cautioned that
LWSPs labeled PROVISIONAL have yet to be reviewed by DWR staff. Subsequent
review may result in significant revision. Questions regarding the accuracy
or limitations of usage of this data should be directed to the water system
and/or DWR.
|