|
The Division of Water Resources (DWR) provides the data contained within this
Local Water Supply Plan (LWSP) as a courtesy and service to our customers.
DWR staff does not field verify data. Neither DWR, nor any other party
involved in the preparation of this LWSP attests that the data is completely
free of errors and omissions. Furthermore, data users are cautioned that
LWSPs labeled PROVISIONAL have yet to be reviewed by DWR staff. Subsequent
review may result in significant revision. Questions regarding the accuracy
or limitations of usage of this data should be directed to the water system
and/or DWR.
1. System Information
Contact Information
Complete
| Water System Name: |
Johnston County |
|
PWSID: |
03-51-070 |
| Mailing Address: | P.O. Box 2263
Smithfield, NC 27577 | Ownership: | County |
| |
| Contact Person: | Chandra Farmer, PE | Title: | Director of Utilities |
| Phone: | 919-989-5075 | Cell/Mobile: | -- |
| |
| Secondary Contact: | James Bryan | | Phone: | 919-989-5075 |
| Mailing Address: | P.O. Box 2263
Smithfield, NC 27577 | Cell/Mobile: | -- |
Distribution System
| Line Type |
Size Range (Inches) |
Estimated % of lines |
| Asbestos Cement |
16 |
0.23 % |
| Ductile Iron |
4-24 |
9.51 % |
| Other |
6-16 |
0.05 % |
| Polyvinyl Chloride |
2-12 |
90.21 % |
There are several areas of the system where water pressure has been identified as inadequate to meet fire flow demands. However, to the best of our knowledge, there are no areas inadequate to meet peak demands, excluding fire flows. Programs
Water Conservation
Effective July 1, 2015, the County's increasing block rate structure started at 5,000 gallons per month for residential users. Prior to that date, the increasing block rate began at 9,000 gallons per month. 2. Water Use Information
Service Area
| Sub-Basin(s) | % of Service Population |
|---|
| Neuse River (10-1) | 100 % |
|
| County(s) | % of Service Population |
|---|
| Johnston | 100 % |
|
Water Use by Type
| Type of Use |
Metered
Connections |
Metered
Average Use (MGD) |
Non-Metered
Connections |
Non-Metered
Estimated Use (MGD) |
| Residential |
35,214 |
4.7175 |
0 |
0.0000 |
| Commercial |
962 |
0.4919 |
0 |
0.0000 |
| Industrial |
15 |
0.0381 |
0 |
0.0000 |
| Institutional |
30 |
0.0730 |
0 |
0.0000 |
How much water was used for system processes (backwash, line cleaning, flushing, etc.)? 2.2870 MGD
2019 average daily water withdrawal from the Neuse River = 9.74 MGD. 2019 average daily water transferred from raw water basins to water treatment plant = 9.79 MGD. 2019 average daily "out the gate" of the WTP =7.635 MGD. Therefore, the 2019 average daily "system process water" used at the WTP is 2.155 MGD. An additional approximately 0.132 MGD is used throughout the distribution system for flushing, line cleaning, etc., which makes total system process water (at plant and distribution system) = 2.287 MGD.
Of the 2.287 MGD plant process water, 0.727 MGD was discharged back to the river and 0.0656 MGD was discharged back to the County's wastewater collection system. An additional 0.129 MGD is metered for use at the water treatment plant for process and chemical mixing, etc. This leaves 1.365 MGD for losses at the WTP. The County continues to work to reduce plant and system losses. The County has a WTP Efficiency project under design to improve process controls. Furthermore, we are working to replace some on-site meters. Water Sales
| Purchaser |
PWSID |
Average
Daily Sold
(MGD) |
Days
Used |
Contract |
Required to
comply with water
use restrictions? |
Pipe Size(s)
(Inches) |
Use
Type |
| MGD |
Expiration |
Recurring |
| Aqua NC/ Flowers Plantation |
03-51-195 |
0.5320 |
365 |
0.7935 |
2072 |
Yes |
Yes |
12 |
Regular |
| Aqua/Various Subdivisions |
00-00-000 |
0.0583 |
365 |
0.0680 |
2039 |
Yes |
No |
4-6 |
Regular |
| Benson |
03-51-025 |
0.0890 |
365 |
0.0900 |
2025 |
Yes |
Yes |
16 |
Regular |
| City of Raleigh |
03-92-010 |
0.0000 |
0 |
2.1500 |
2028 |
No |
Yes |
16 |
Emergency |
| Clayton |
03-51-020 |
3.9220 |
365 |
4.7500 |
|
Yes |
Yes |
16 |
Regular |
| Fork Township Sanitary District |
04-96-060 |
0.0000 |
0 |
0.1500 |
2023 |
Yes |
Yes |
8 |
Emergency |
| Four Oaks |
03-51-035 |
0.2690 |
365 |
0.3000 |
|
Yes |
Yes |
10 |
Regular |
| Fuquay Varina |
03-92-055 |
0.4650 |
365 |
1.5000 |
2020 |
Yes |
Yes |
16 |
Regular |
| Kenly |
03-51-030 |
0.1690 |
365 |
0.2950 |
|
Yes |
Yes |
16 |
Regular |
| Micro (County Line) |
40-51-008 |
0.0020 |
365 |
0.0050 |
|
Yes |
Yes |
16 |
Regular |
| Pine Level |
03-51-040 |
0.0130 |
365 |
0.0370 |
|
Yes |
Yes |
16 |
Regular |
| Princeton |
03-51-050 |
0.1380 |
365 |
0.1697 |
|
Yes |
Yes |
12 |
Regular |
| Selma (County Line System) |
40-51-009 |
0.1180 |
365 |
0.2150 |
|
Yes |
Yes |
16 |
Regular |
| Smithfield South Water District |
40-51-007 |
0.0540 |
365 |
0.0000 |
2024 |
Yes |
No |
16 |
Regular |
| Town of Selma |
03-51-015 |
0.0270 |
1 |
|
|
Yes |
Yes |
10" |
Emergency |
| Wayne County WD |
04-96-065 |
0.0000 |
0 |
0.2500 |
2023 |
Yes |
Yes |
8 |
Regular |
| White Oak Plantation (CWS) |
03-51-160 |
0.0310 |
365 |
|
2048 |
Yes |
Yes |
8 |
Regular |
| Willowbrook Development (CWS) |
03-51-166 |
0.0140 |
365 |
|
|
|
Yes |
4 |
Regular |
| Winston Plantation (CWS) |
40-51-002 |
0.0120 |
365 |
|
|
|
Yes |
6 |
Regular |
| Winston Point (CWS) |
40-51-012 |
0.0420 |
365 |
|
2048 |
Yes |
Yes |
6 |
Regular |
1. The water system labeled as "Aqua/Various Subdivisions" includes South Plantation Subdivision Phases 14 and 15, Sun Ridge Farm Subdivision and South Gate Subdivision Section 20.
2. The contract with Wayne Water Districts is a seasonal contract. Wayne can purchase water from Johnston County on a daily basis during the months of November through April. The interconnection is available all year for emergencies. Wayne County did not purchase water from Johnston County in 2019. 3. Water Supply Sources
Monthly Withdrawals & Purchases
|
Average Daily
Use (MGD) |
Max Day
Use (MGD) |
|
Average Daily
Use (MGD) |
Max Day
Use (MGD) |
|
Average Daily
Use (MGD) |
Max Day
Use (MGD) |
| Jan |
12.2710 |
15.8890 |
May |
16.0170 |
19.9520 |
Sep |
14.6290 |
17.5890 |
| Feb |
11.4410 |
15.6170 |
Jun |
15.2980 |
17.8640 |
Oct |
13.9520 |
18.8640 |
| Mar |
12.3970 |
15.9680 |
Jul |
16.0850 |
20.1130 |
Nov |
12.1120 |
17.9500 |
| Apr |
12.3720 |
15.9820 |
Aug |
15.1890 |
19.3590 |
Dec |
12.2420 |
16.8010 |

Surface Water Sources
| Stream |
Reservoir |
Average Daily Withdrawal |
Maximum Day
Withdrawal (MGD) |
Available Raw
Water Supply |
Usable On-Stream
Raw Water Supply
Storage (MG) |
| MGD |
Days Used |
MGD |
* Qualifier |
| Neuse River |
Neuse |
9.7300 |
365 |
13.8600 |
12.0000 |
F |
0.0000 |
* Qualifier: C=Contract Amount, SY20=20-year Safe Yield, SY50=50-year Safe Yield, F=20% of 7Q10 or other instream flow requirement, CUA=Capacity Use Area Permit
Surface Water Sources (continued)
| Stream |
Reservoir |
Drainage Area
(sq mi) |
Metered? |
Sub-Basin |
County |
Year
Offline |
Use
Type |
| Neuse River |
Neuse |
1,200 |
Yes |
Neuse River (10-1) |
Johnston |
|
Regular |
Water Purchases From Other Systems
| Seller |
PWSID |
Average
Daily Purchased
(MGD) |
Days
Used |
Contract |
Required to
comply with water
use restrictions? |
Pipe Size(s)
(Inches) |
Use
Type |
| MGD |
Expiration |
Recurring |
| Benson |
03-51-025 |
0.0020 |
365 |
0.0100 |
2025 |
Yes |
Yes |
16 |
Regular |
| City of Raleigh |
03-92-010 |
0.0180 |
21 |
2.1500 |
2028 |
Yes |
No |
16 |
Emergency |
| City of Wilson |
04-98-010 |
0.5096 |
365 |
1.5000 |
2033 |
No |
Yes |
12 |
Regular |
| Fork Township SD |
04-96-060 |
0.0000 |
0 |
0.1500 |
2022 |
Yes |
No |
12 |
Emergency |
| Fuquay Varina |
03-92-055 |
0.0000 |
0 |
0.0000 |
|
No |
Yes |
16 |
Emergency |
| Harnett County RWS |
03-43-045 |
1.1640 |
365 |
2.5000 |
2056 |
Yes |
Yes |
12 |
Regular |
| Smithfield |
03-51-010 |
2.3000 |
365 |
3.5000 |
2033 |
Yes |
Yes |
16 |
Regular |
| Wayne County WD |
04-96-065 |
0.0956 |
365 |
0.4500 |
2022 |
Yes |
Yes |
6 |
Regular |
Water Treatment Plants
| Plant Name |
Permitted Capacity
(MGD) |
Is Raw Water Metered? |
Is Finished Water Ouput Metered? |
Source |
| Johnston County WTP |
12.0000 |
Yes |
Yes |
Neuse River |
4. Wastewater Information
Monthly Discharges
|
Average Daily
Discharge (MGD) |
|
Average Daily
Discharge (MGD) |
|
Average Daily
Discharge (MGD) |
| Jan |
6.7860 |
May |
4.9120 |
Sep |
5.6860 |
| Feb |
7.1080 |
Jun |
4.9660 |
Oct |
4.8240 |
| Mar |
6.8570 |
Jul |
5.1820 |
Nov |
4.6630 |
| Apr |
6.8620 |
Aug |
5.2370 |
Dec |
5.8340 |
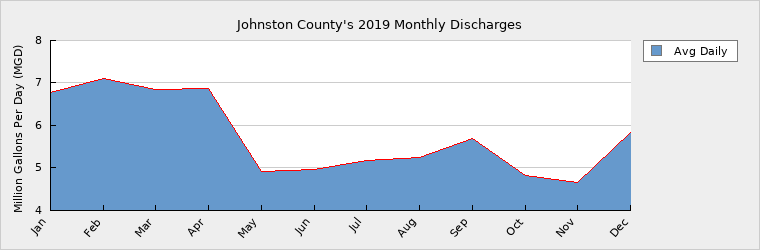
The monthly values reported in Section 4 are for the County’s WWTP NPDES discharge only (NC0030716). The volume of wastewater discharged to the Town of Benson and the water discharged under permit NC0084735 (discharge at WTP) are not included in these monthly numbers. Wastewater Permits
| Permit Number |
Type |
Permitted Capacity
(MGD) |
Design Capacity
(MGD) |
Average Annual
Daily Discharge
(MGD) |
Maximum Day Discharge
(MGD) |
Receiving Stream |
Receiving Basin |
| NC0030716 |
|
9.5000 |
9.5000 |
5.7430 |
12.3560 |
Neuse River (10-1) |
Neuse River (10-1) |
| NC0084735 |
|
4.0000 |
4.0000 |
0.7270 |
1.7800 |
Neuse River |
Neuse River (10-1) |
Wastewater Interconnections
| Water System |
PWSID |
Type |
Average Daily Amount |
Contract
Maximum (MGD) |
| MGD |
Days Used |
| Benson |
03-51-025 |
Discharging |
0.1050 |
365 |
0.1920 |
| Clayton |
03-51-020 |
Receiving |
0.7290 |
365 |
0.9000 |
| Four Oaks |
03-51-035 |
Receiving |
0.1500 |
365 |
0.0000 |
| Pine Level |
03-51-040 |
Receiving |
0.2000 |
365 |
0.0000 |
| Selma |
03-51-015 |
Receiving |
1.1410 |
365 |
0.0000 |
| Smithfield |
03-51-010 |
Receiving |
2.0780 |
365 |
0.0000 |
| Winston Point (CWS) |
40-51-012 |
Receiving |
0.0680 |
365 |
0.4600 |
Based on Johnston County’s records, the County received 0.150 MGD from the Town of Four Oaks in 2019. 5. Planning
Projections
| |
2019 |
2020 |
2030 |
2040 |
2050 |
2060 |
| Year-Round Population |
88,035 |
102,588 |
151,839 |
193,459 |
221,965 |
250,750 |
| Seasonal Population |
0 |
0 |
0 |
0 |
0 |
0 |
| |
| Residential |
4.7175 |
5.1600 |
7.5920 |
9.6730 |
11.0983 |
12.5375 |
| Commercial |
0.4919 |
0.7100 |
0.9400 |
1.0950 |
1.1360 |
1.1610 |
| Industrial |
0.0381 |
0.0500 |
0.0660 |
0.0770 |
0.0800 |
0.0820 |
| Institutional |
0.0730 |
0.0940 |
0.1200 |
0.1440 |
0.1500 |
0.1530 |
| System Process |
2.2870 |
2.2870 |
1.5000 |
1.7000 |
1.9000 |
2.2000 |
| Unaccounted-for |
0.2663 |
0.4544 |
0.4999 |
0.5498 |
0.6048 |
0.6653 |
Future Water Sales
| Purchaser |
PWSID |
Contract |
Pipe Size(s) (Inches) |
Use Type |
| MGD |
Year Begin |
Year End |
| Various Water Systems |
00-00-000 |
0.7500 |
2020 |
|
|
Regular |
| Various Watery Systems |
00-00-000 |
4.5000 |
2021 |
|
|
Regular |
The County does not have detailed (quantified) information from each system that purchases from the County. We have estimated future bulk demands from most of our bulk customers. Future Supply Sources
| Source Name |
PWSID |
Source Type |
Additional Supply |
Year Online |
Year Offline |
Type |
| City of Raleigh |
03-92-010 |
Purchase |
2.0000 |
2021 |
2030 |
Regular |
| City of Wilson |
04-98-010 |
Purchase |
0.4900 |
2021 |
2041 |
Regular |
| City of Wilson |
04-98-010 |
Purchase |
1.0000 |
2025 |
2050 |
Regular |
| Neuse River |
03-51-070 |
Surface |
2.0000 |
2020 |
2080 |
Regular |
| Neuse River |
03-51-070 |
Surface |
4.0000 |
2025 |
2070 |
Regular |
| Neuse River (Lower) |
03-51-070 |
Surface |
12.0000 |
2030 |
2080 |
Regular |
| Sampson County Water District I - Clinton |
03-82-050 |
Purchase |
0.1500 |
2020 |
2050 |
Regular |
| Sampson County Water District I - Clinton |
03-82-050 |
Purchase |
0.3500 |
2021 |
2050 |
Regular |
Demand v/s Percent of Supply
| |
2019 |
2020 |
2030 |
2040 |
2050 |
2060 |
| Surface Water Supply |
12.0000 |
12.0000 |
12.0000 |
12.0000 |
12.0000 |
12.0000 |
| Ground Water Supply |
0.0000 |
0.0000 |
0.0000 |
0.0000 |
0.0000 |
0.0000 |
| Purchases |
7.9600 |
7.9600 |
7.9600 |
6.4600 |
6.4600 |
6.4600 |
| Future Supplies |
2.1500 |
19.9900 |
19.9900 |
18.0000 |
18.0000 |
| Total Available Supply (MGD) |
19.9600 |
22.1100 |
39.9500 |
38.4500 |
36.4600 |
36.4600 |
| Service Area Demand |
7.8738 |
8.7554 |
10.7179 |
13.2388 |
14.9691 |
16.7988 |
| Sales |
5.9284 |
8.6262 |
8.6262 |
8.6262 |
8.6262 |
8.6262 |
| Future Sales |
0.7500 |
5.2500 |
5.2500 |
5.2500 |
5.2500 |
| Total Demand (MGD) |
13.8022 |
18.1316 |
24.5941 |
27.1150 |
28.8453 |
30.6750 |
| Demand as Percent of Supply |
69% |
82% |
62% |
71% |
79% |
84% |

The purpose of the above chart is to show a general indication of how the long-term per capita water demand changes over time. The per capita water demand may actually be different than indicated due to seasonal populations and the accuracy of data submitted. Water systems that have calculated long-term per capita water demand based on a methodology that produces different results may submit their information in the notes field.
Your long-term water demand is 54 gallons per capita per day. What demand management practices do you plan to implement to reduce the per capita water demand (i.e. conduct regular water audits, implement a plumbing retrofit program, employ practices such as rainwater harvesting or reclaimed water)? If these practices are covered elsewhere in your plan, indicate where the practices are discussed here.
N/A
Are there other demand management practices you will implement to reduce your future supply needs? N/A
What supplies other than the ones listed in future supplies are being considered to meet your future supply needs? Additional purchase supplies from Sampson County, Harnett County and Wilson.
Off-line reservoir construction for storage.
How does the water system intend to implement the demand management and supply planning components above? Hazen & Sawyer is working on a Long Term Water Supply plan for the County now. Options include:
- Pursue an in-stream flow study to get additional supply from the Neuse River at the existing intake
- Construction of off-stream storage reservoir
- Potential new intake on Neuse downstream of (confluence of Swift and Middle Creek)
- Finished or raw water purchase from City of Wilson (Buckhorn reservoir)
- Indirect potable reuse
Additional Information
Has this system participated in regional water supply or water use planning? Yes, Triangle Water Partnership
What major water supply reports or studies were used for planning?
Please describe any other needs or issues regarding your water supply sources, any water system deficiencies or needed improvements (storage, treatment, etc.) or your ability to meet present and future water needs. Include both quantity and quality considerations, as well as financial, technical, managerial, permitting, and compliance issues:
The Division of Water Resources (DWR) provides the data contained within this
Local Water Supply Plan (LWSP) as a courtesy and service to our customers.
DWR staff does not field verify data. Neither DWR, nor any other party
involved in the preparation of this LWSP attests that the data is completely
free of errors and omissions. Furthermore, data users are cautioned that
LWSPs labeled PROVISIONAL have yet to be reviewed by DWR staff. Subsequent
review may result in significant revision. Questions regarding the accuracy
or limitations of usage of this data should be directed to the water system
and/or DWR.
|