|
The Division of Water Resources (DWR) provides the data contained within this
Local Water Supply Plan (LWSP) as a courtesy and service to our customers.
DWR staff does not field verify data. Neither DWR, nor any other party
involved in the preparation of this LWSP attests that the data is completely
free of errors and omissions. Furthermore, data users are cautioned that
LWSPs labeled PROVISIONAL have yet to be reviewed by DWR staff. Subsequent
review may result in significant revision. Questions regarding the accuracy
or limitations of usage of this data should be directed to the water system
and/or DWR.
1. System Information
Contact Information
Provisional
| Water System Name: |
Johnston County |
|
PWSID: |
03-51-070 |
| Mailing Address: | P.O. Box 2263
Smithfield, NC 27577 | Ownership: | County |
| |
| Contact Person: | Chandra Farmer, PE | Title: | Director of Utilities |
| Phone: | 919-989-5075 | Cell/Mobile: | -- |
| |
| Secondary Contact: | Howard Mills II | | Phone: | 919-989-5075 |
| Mailing Address: | P.O. Box 2263
Smithfield, NC 27577 | Cell/Mobile: | -- |
Distribution System
| Line Type |
Size Range (Inches) |
Estimated % of lines |
| Asbestos Cement |
16 |
0.04 % |
| Ductile Iron |
4-24 |
10.52 % |
| Other |
6-16 |
0.10 % |
| Polyvinyl Chloride |
2-12 |
89.34 % |
Programs
Water Conservation
2. Water Use Information
Service Area
| Sub-Basin(s) | % of Service Population |
|---|
| Neuse River (10-1) | 100 % |
|
| County(s) | % of Service Population |
|---|
| Johnston | 100 % |
|
Water Use by Type
| Type of Use |
Metered
Connections |
Metered
Average Use (MGD) |
Non-Metered
Connections |
Non-Metered
Estimated Use (MGD) |
| Residential |
45,496 |
6.1631 |
0 |
0.0000 |
| Commercial |
1,085 |
0.4261 |
0 |
0.0000 |
| Industrial |
15 |
0.0649 |
0 |
0.0000 |
| Institutional |
31 |
0.1240 |
0 |
0.0000 |
How much water was used for system processes (backwash, line cleaning, flushing, etc.)? 1.5580 MGD
1.558 MGD process water includes metered water for use at the Timothy G. Broome WTP site (chemical mixing, etc) and other process water (example, cone blow-down, filter to waste, etc). 1.558 MGD was determined based on transfer flow into the plant minus water out the gate. Water Sales
| Purchaser |
PWSID |
Average
Daily Sold
(MGD) |
Days
Used |
Contract |
Required to
comply with water
use restrictions? |
Pipe Size(s)
(Inches) |
Use
Type |
| MGD |
Expiration |
Recurring |
| Aqua NC/ Flowers Plantation |
03-51-195 |
0.7878 |
366 |
1.1070 |
2072 |
Yes |
Yes |
12 |
Regular |
| Aqua/Various Subdivisions |
00-00-000 |
0.0551 |
366 |
0.0680 |
2039 |
Yes |
No |
4-6 |
Regular |
| Benson |
03-51-025 |
0.1219 |
366 |
0.0900 |
2025 |
Yes |
Yes |
16 |
Regular |
| City of Raleigh |
03-92-010 |
0.0000 |
0 |
2.5000 |
2031 |
No |
Yes |
16 |
Emergency |
| Clayton |
03-51-020 |
3.8000 |
366 |
6.1500 |
|
Yes |
Yes |
16 |
Regular |
| Fork Township Sanitary District |
04-96-060 |
0.0000 |
0 |
0.1500 |
2023 |
No |
Yes |
8 |
Emergency |
| Four Oaks |
03-51-035 |
0.2758 |
366 |
0.4150 |
|
Yes |
Yes |
10 |
Regular |
| Fuquay Varina |
03-92-055 |
0.3438 |
366 |
1.5000 |
2049 |
No |
Yes |
16 |
Regular |
| Kenly |
03-51-030 |
0.2260 |
366 |
0.2950 |
|
Yes |
Yes |
16 |
Regular |
| Micro (County Line) |
40-51-008 |
0.0030 |
366 |
0.0050 |
|
Yes |
Yes |
16 |
Regular |
| Pine Level |
03-51-040 |
0.0196 |
366 |
0.0370 |
|
Yes |
Yes |
16 |
Regular |
| Princeton |
03-51-050 |
0.1624 |
366 |
0.1750 |
|
Yes |
Yes |
12 |
Regular |
| Selma (County Line System) |
40-51-009 |
0.0892 |
366 |
0.2150 |
|
Yes |
Yes |
16 |
Regular |
| Smithfield South Water District |
40-51-007 |
0.0570 |
366 |
0.0000 |
2024 |
Yes |
No |
16 |
Regular |
| Town of Selma |
03-51-015 |
0.0910 |
366 |
|
|
Yes |
Yes |
10 |
Emergency |
| Wayne County WD |
04-96-065 |
0.0000 |
0 |
0.6000 |
2028 |
No |
Yes |
8 |
Emergency |
| White Oak Plantation (CWS) |
03-51-160 |
0.0275 |
366 |
|
2048 |
Yes |
Yes |
8 |
Regular |
| Willowbrook Development (CWS) |
03-51-166 |
0.0152 |
366 |
|
|
|
Yes |
4 |
Regular |
| Winston Plantation (CWS) |
40-51-002 |
0.0117 |
366 |
|
|
|
Yes |
6 |
Regular |
| Winston Point (CWS) |
40-51-012 |
0.0840 |
366 |
|
2048 |
Yes |
Yes |
6 |
Regular |
3. Water Supply Sources
Monthly Withdrawals & Purchases
|
Average Daily
Use (MGD) |
Max Day
Use (MGD) |
|
Average Daily
Use (MGD) |
Max Day
Use (MGD) |
|
Average Daily
Use (MGD) |
Max Day
Use (MGD) |
| Jan |
14.5040 |
15.7560 |
May |
17.2070 |
20.9400 |
Sep |
16.1180 |
18.3370 |
| Feb |
13.5050 |
15.3690 |
Jun |
19.7050 |
22.4630 |
Oct |
16.5080 |
17.9590 |
| Mar |
14.9420 |
17.0560 |
Jul |
18.0020 |
20.5160 |
Nov |
15.0570 |
17.3400 |
| Apr |
15.9260 |
19.2350 |
Aug |
17.2100 |
19.6400 |
Dec |
14.5120 |
15.7330 |
Based on water transfer into Timothy G. Broome WTP plus purchase from other systems. 
Surface Water Sources
| Stream |
Reservoir |
Average Daily Withdrawal |
Maximum Day
Withdrawal (MGD) |
Available Raw
Water Supply |
Usable On-Stream
Raw Water Supply
Storage (MG) |
| MGD |
Days Used |
MGD |
* Qualifier |
| Neuse River |
Neuse |
9.5800 |
365 |
14.1200 |
17.0000 |
F |
0.0000 |
* Qualifier: C=Contract Amount, SY20=20-year Safe Yield, SY50=50-year Safe Yield, F=20% of 7Q10 or other instream flow requirement, CUA=Capacity Use Area Permit
Surface Water Sources (continued)
| Stream |
Reservoir |
Drainage Area
(sq mi) |
Metered? |
Sub-Basin |
County |
Year
Offline |
Use
Type |
| Neuse River |
Neuse |
1,200 |
Yes |
Neuse River (10-1) |
Johnston |
|
Regular |
Water Purchases From Other Systems
| Seller |
PWSID |
Average
Daily Purchased
(MGD) |
Days
Used |
Contract |
Required to
comply with water
use restrictions? |
Pipe Size(s)
(Inches) |
Use
Type |
| MGD |
Expiration |
Recurring |
| Benson |
03-51-025 |
0.0020 |
366 |
0.0100 |
2025 |
Yes |
Yes |
16 |
Regular |
| City of Raleigh |
03-92-010 |
0.8490 |
366 |
2.5000 |
2031 |
No |
Yes |
16 |
Regular |
| City of Wilson |
04-98-010 |
0.6310 |
366 |
1.5000 |
2033 |
No |
Yes |
12 |
Regular |
| Fork Township SD |
04-96-060 |
0.0000 |
0 |
0.1500 |
2022 |
No |
No |
12 |
Emergency |
| Fuquay Varina |
03-92-055 |
0.0000 |
0 |
0.0000 |
|
No |
Yes |
16 |
Emergency |
| Harnett County RWS |
03-43-045 |
1.2687 |
366 |
2.5000 |
2056 |
Yes |
Yes |
12 |
Regular |
| Sampson County - Clinton |
03-82-050 |
0.4550 |
366 |
0.5000 |
2049 |
Yes |
No |
6 12 |
Regular |
| Smithfield |
03-51-010 |
2.9600 |
366 |
3.5000 |
2033 |
Yes |
Yes |
16 |
Regular |
| Wayne County WD |
04-96-065 |
0.4280 |
366 |
0.6000 |
2022 |
Yes |
Yes |
6 |
Regular |
Water Treatment Plants
| Plant Name |
Permitted Capacity
(MGD) |
Is Raw Water Metered? |
Is Finished Water Ouput Metered? |
Source |
| Johnston County WTP |
14.0000 |
Yes |
Yes |
Neuse River |
4. Wastewater Information
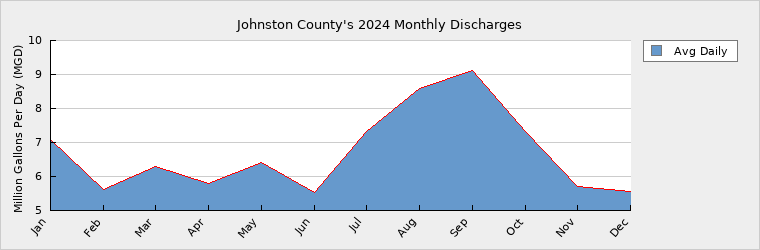
Monthly Discharges
|
Average Daily
Discharge (MGD) |
|
Average Daily
Discharge (MGD) |
|
Average Daily
Discharge (MGD) |
| Jan |
7.0990 |
May |
6.4240 |
Sep |
9.1170 |
| Feb |
5.6040 |
Jun |
5.5270 |
Oct |
7.3370 |
| Mar |
6.2820 |
Jul |
7.3090 |
Nov |
5.6960 |
| Apr |
5.8080 |
Aug |
8.6010 |
Dec |
5.5560 |
Wastewater Permits
| Permit Number |
Type |
Permitted Capacity
(MGD) |
Design Capacity
(MGD) |
Average Annual
Daily Discharge
(MGD) |
Maximum Day Discharge
(MGD) |
Receiving Stream |
Receiving Basin |
| NC0030716 |
WWTP |
16.0000 |
16.0000 |
6.5803 |
19.6900 |
Neuse River (10-1) |
Neuse River (10-1) |
| NC0084735 |
WTP |
4.0000 |
4.0000 |
1.0000 |
2.6000 |
Neuse River |
Neuse River (10-1) |
NC 0030716 includes two treatment plants - the Central Regional WWTF and the 210 WWTF. There is a current project to expand the 210 WWTF from 4 MGD to 8 MGD and rerate the CR WWTF to 8 MGD for a combined total of 16 MGD. This is reflected in out current NPDES permit. Wastewater Interconnections
| Water System |
PWSID |
Type |
Average Daily Amount |
Contract
Maximum (MGD) |
| MGD |
Days Used |
| Benson |
03-51-025 |
Discharging |
0.0030 |
365 |
0.1920 |
| Aqua Flowers Plantation |
03-51-195 |
Receiving |
0.2920 |
365 |
0.5000 |
| Clayton |
03-51-020 |
Receiving |
1.3200 |
365 |
0.9000 |
| Four Oaks |
03-51-035 |
Receiving |
0.2840 |
365 |
|
| Pine Level |
03-51-040 |
Receiving |
0.2910 |
365 |
|
| Selma |
03-51-015 |
Receiving |
1.0540 |
365 |
|
| Smithfield |
03-51-010 |
Receiving |
1.9270 |
365 |
|
| Winston Point (CWS) |
40-51-012 |
Receiving |
0.0960 |
365 |
0.4600 |
Flow discharged to Town of Benson is based on County retail customer flow only. In addition, the majority of wastewater flow received from the Town of Four Oaks is also discharged by the County into the Town of Benson WWTF. 5. Planning
Projections
| |
2024 |
2030 |
2040 |
2050 |
2060 |
2070 |
| Year-Round Population |
115,332 |
122,535 |
133,340 |
141,215 |
149,550 |
158,380 |
| Seasonal Population |
0 |
0 |
0 |
0 |
0 |
0 |
| |
| Residential |
6.1631 |
6.5500 |
7.1300 |
7.5500 |
7.9900 |
8.4600 |
| Commercial |
0.4261 |
0.4500 |
0.4900 |
0.5200 |
0.5500 |
0.5900 |
| Industrial |
0.0649 |
1.0700 |
1.1600 |
1.2300 |
1.3000 |
1.3800 |
| Institutional |
0.1240 |
0.1300 |
0.1400 |
0.1500 |
0.1600 |
0.1700 |
| System Process |
1.5580 |
1.8000 |
2.0000 |
2.3000 |
2.5000 |
2.6500 |
| Unaccounted-for |
1.6404 |
1.1000 |
1.3000 |
1.3300 |
1.3800 |
1.4000 |
Future Water Sales
| Purchaser |
PWSID |
Contract |
Pipe Size(s) (Inches) |
Use Type |
| MGD |
Year Begin |
Year End |
| Combined Bulk Sales |
03-51-070 |
3.1000 |
2030 |
2075 |
12-16 |
Regular |
| Combined Bulk Sales |
03-51-070 |
5.0000 |
2040 |
2075 |
12-16 |
Regular |
| Combined Bulk Sales |
03-51-070 |
6.0000 |
2050 |
2080 |
12-16 |
Regular |
| Combined Bulk Sales |
03-51-070 |
1.6000 |
2060 |
2090 |
12-16 |
Regular |
| Combined Bulk Sales |
03-51-070 |
1.5000 |
2070 |
2100 |
12-16 |
Regular |
Future Supply Sources
| Source Name |
PWSID |
Source Type |
Additional Supply |
Year Online |
Year Offline |
Type |
| City of Raleigh |
03-92-010 |
Surface |
2.0000 |
2026 |
2036 |
Regular |
| JC Lower Neuse Water Supply |
03-51-020 |
Surface |
12.0000 |
2032 |
2092 |
Regular |
| JC Lower Neuse Water Supply |
03-51-070 |
Surface |
6.0000 |
2042 |
|
Regular |
| JC Lower Neuse Water Supply |
03-51-070 |
Surface |
6.0000 |
2049 |
|
Regular |
Demand v/s Percent of Supply
| |
2024 |
2030 |
2040 |
2050 |
2060 |
2070 |
| Surface Water Supply |
17.0000 |
17.0000 |
17.0000 |
17.0000 |
17.0000 |
17.0000 |
| Ground Water Supply |
0.0000 |
0.0000 |
0.0000 |
0.0000 |
0.0000 |
0.0000 |
| Purchases |
11.1100 |
11.1100 |
7.1100 |
7.1100 |
7.1100 |
7.1100 |
| Future Supplies |
2.0000 |
12.0000 |
24.0000 |
24.0000 |
24.0000 |
| Total Available Supply (MGD) |
28.1100 |
30.1100 |
36.1100 |
48.1100 |
48.1100 |
48.1100 |
| Service Area Demand |
9.9765 |
11.1000 |
12.2200 |
13.0800 |
13.8800 |
14.6500 |
| Sales |
6.1710 |
10.3753 |
10.3753 |
8.8753 |
8.8753 |
8.8753 |
| Future Sales |
3.1000 |
8.1000 |
14.1000 |
15.7000 |
17.2000 |
| Total Demand (MGD) |
16.1475 |
24.5753 |
30.6953 |
36.0553 |
38.4553 |
40.7253 |
| Demand as Percent of Supply |
57% |
82% |
85% |
75% |
80% |
85% |

The purpose of the above chart is to show a general indication of how the long-term per capita water demand changes over time. The per capita water demand may actually be different than indicated due to seasonal populations and the accuracy of data submitted. Water systems that have calculated long-term per capita water demand based on a methodology that produces different results may submit their information in the notes field.
Your long-term water demand is 53 gallons per capita per day. What demand management practices do you plan to implement to reduce the per capita water demand (i.e. conduct regular water audits, implement a plumbing retrofit program, employ practices such as rainwater harvesting or reclaimed water)? If these practices are covered elsewhere in your plan, indicate where the practices are discussed here.
Johnston County has an active reclaimed water system. The County will continue to pursue opportunities to expand reclaimed water use. In addition the County will perform regular water audits and develop a leak detection program.
Are there other demand management practices you will implement to reduce your future supply needs? The County has year-round mandatory water alternating day watering policy to reduce peak demands.
https://www.johnstonnc.gov/utilities/conserve.cfm
The County is in the final stages of preparing a revision to our drought management plan.
What supplies other than the ones listed in future supplies are being considered to meet your future supply needs? We are considering additional connections with neighboring systems for regional solutions and increase resiliency.
How does the water system intend to implement the demand management and supply planning components above? The County will continue to participate in the Triangle Water Supply Partnership and actively work with neighboring systems to meet regional water supply. We will actively pursue opportunities to expand the use of reclaimed water to supplant potable water uses.
Additional Information
Has this system participated in regional water supply or water use planning? Yes, Johnston County is a member of the Triangle Water Supply Partnership. Together with the other members of the partnership we are working with DWR on a long term water supply plan for the triangle that encompasses both the Neuse and Cape Fear Rivers.
What major water supply reports or studies were used for planning? Johnston County works with Hazen and Sawyer to prepared a long term water supply plan.
Please describe any other needs or issues regarding your water supply sources, any water system deficiencies or needed improvements (storage, treatment, etc.) or your ability to meet present and future water needs. Include both quantity and quality considerations, as well as financial, technical, managerial, permitting, and compliance issues: Our new long term water supply plan included using one quarry as storage initially and a second quarry with future expansions. The two quarries combined will provide over 3 billion gallons of storage.
The Division of Water Resources (DWR) provides the data contained within this
Local Water Supply Plan (LWSP) as a courtesy and service to our customers.
DWR staff does not field verify data. Neither DWR, nor any other party
involved in the preparation of this LWSP attests that the data is completely
free of errors and omissions. Furthermore, data users are cautioned that
LWSPs labeled PROVISIONAL have yet to be reviewed by DWR staff. Subsequent
review may result in significant revision. Questions regarding the accuracy
or limitations of usage of this data should be directed to the water system
and/or DWR.
|