|
The Division of Water Resources (DWR) provides the data contained within this
Local Water Supply Plan (LWSP) as a courtesy and service to our customers.
DWR staff does not field verify data. Neither DWR, nor any other party
involved in the preparation of this LWSP attests that the data is completely
free of errors and omissions. Furthermore, data users are cautioned that
LWSPs labeled PROVISIONAL have yet to be reviewed by DWR staff. Subsequent
review may result in significant revision. Questions regarding the accuracy
or limitations of usage of this data should be directed to the water system
and/or DWR.
1. System Information
Contact Information
Complete
| Water System Name: |
Sanford |
|
PWSID: |
03-53-010 |
| Mailing Address: | PO Box 3729
Sanford, NC 27331 | Ownership: | Municipality |
| |
| Contact Person: | Victor Czar | Title: | Assistant City Manager |
| Phone: | 919-777-1118 | Cell/Mobile: | -- |
| |
| Secondary Contact: | Paul Weeks | | Phone: | 919-777-1119 |
| Mailing Address: | PO Box 3729
Sanford, NC 27331 | Cell/Mobile: | -- |
Distribution System
| Line Type |
Size Range (Inches) |
Estimated % of lines |
| Asbestos Cement |
6-12 |
14.00 % |
| Cast Iron |
6-16 |
3.10 % |
| Ductile Iron |
6-36 |
9.80 % |
| Galvanized Iron |
2-4 |
0.40 % |
| Other |
16-24 |
1.00 % |
| Polyvinyl Chloride |
6-12 |
71.70 % |
Programs
Water Conservation
In the short term, there is no system capable of providing Sanford's water needs nor does the infrastructure exist to convey it. Long term options for emergency connection are being investigated by the City in collaboration with the Western Intake Partners treatment facility, currently in design, and infrastructure connections from the recent merger with the Town of Pittsboro. 2. Water Use Information
Service Area
| Sub-Basin(s) | % of Service Population |
|---|
| Cape Fear River (02-3) | 60 % |
| Deep River (02-2) | 40 % |
|
| County(s) | % of Service Population |
|---|
| Lee | 99 % |
| Chatham | 1 % |
|
While Sanford (TriRiver Water) merged with the Town of Pittsboro effective July 1, 2024, infrastructure connecting the two systems is not yet complete. Water Use by Type
| Type of Use |
Metered
Connections |
Metered
Average Use (MGD) |
Non-Metered
Connections |
Non-Metered
Estimated Use (MGD) |
| Residential |
20,238 |
2.2200 |
0 |
0.0000 |
| Commercial |
2,124 |
1.3600 |
0 |
0.0000 |
| Industrial |
39 |
0.4400 |
0 |
0.0000 |
| Institutional |
58 |
0.5500 |
0 |
0.0000 |
How much water was used for system processes (backwash, line cleaning, flushing, etc.)? 1.5600 MGD
System process water - 1.04MGD (blowoffs) + 0.52 MGD (NPDES discharge at the WTP) = 1.56 MGD Water Sales
| Purchaser |
PWSID |
Average
Daily Sold
(MGD) |
Days
Used |
Contract |
Required to
comply with water
use restrictions? |
Pipe Size(s)
(Inches) |
Use
Type |
| MGD |
Expiration |
Recurring |
| Chatham County Asbury |
40-19-010 |
0.5100 |
365 |
1.5000 |
2024 |
Yes |
Yes |
8-12 |
Regular |
| Chatham County North Water System |
03-19-126 |
0.0000 |
0 |
0.5000 |
|
Yes |
Yes |
|
Emergency |
| Goldston-Gulf |
03-19-025 |
0.1000 |
365 |
0.2500 |
2020 |
Yes |
Yes |
10 |
Regular |
| Town of Broadway |
03-53-015 |
0.1000 |
365 |
0.3000 |
2012 |
Yes |
Yes |
10 |
Regular |
| Utilities, Inc. (Carolina Trace) |
03-53-101 |
0.2400 |
365 |
0.2890 |
1996 |
Yes |
Yes |
12 |
Regular |
3. Water Supply Sources
Monthly Withdrawals & Purchases
|
Average Daily
Use (MGD) |
Max Day
Use (MGD) |
|
Average Daily
Use (MGD) |
Max Day
Use (MGD) |
|
Average Daily
Use (MGD) |
Max Day
Use (MGD) |
| Jan |
7.3970 |
8.8340 |
May |
7.8480 |
9.0670 |
Sep |
8.1900 |
9.6900 |
| Feb |
7.2610 |
8.4600 |
Jun |
8.9410 |
9.9670 |
Oct |
8.1590 |
8.9050 |
| Mar |
7.2850 |
8.7450 |
Jul |
8.7030 |
10.2060 |
Nov |
7.8240 |
8.8370 |
| Apr |
7.5810 |
8.9380 |
Aug |
8.7510 |
9.6770 |
Dec |
7.5420 |
8.6990 |

Surface Water Sources
| Stream |
Reservoir |
Average Daily Withdrawal |
Maximum Day
Withdrawal (MGD) |
Available Raw
Water Supply |
Usable On-Stream
Raw Water Supply
Storage (MG) |
| MGD |
Days Used |
MGD |
* Qualifier |
| Cape Fear |
Yarborough Lake |
7.9570 |
365 |
0.0000 |
12.6000 |
SY50 |
200.0000 |
* Qualifier: C=Contract Amount, SY20=20-year Safe Yield, SY50=50-year Safe Yield, F=20% of 7Q10 or other instream flow requirement, CUA=Capacity Use Area Permit
Surface Water Sources (continued)
| Stream |
Reservoir |
Drainage Area
(sq mi) |
Metered? |
Sub-Basin |
County |
Year
Offline |
Use
Type |
| Cape Fear |
Yarborough Lake |
3,100 |
Yes |
Cape Fear River (02-3) |
Lee |
|
Regular |
Water Purchases From Other Systems
| Seller |
PWSID |
Average
Daily Purchased
(MGD) |
Days
Used |
Contract |
Required to
comply with water
use restrictions? |
Pipe Size(s)
(Inches) |
Use
Type |
| MGD |
Expiration |
Recurring |
| Chatham County North Water System |
03-19-126 |
0.0000 |
0 |
0.5000 |
|
Yes |
Yes |
|
Emergency |
| Triangle J Mutual Aid Contract |
00-00-000 |
0.0000 |
0 |
0.0000 |
|
Yes |
No |
|
Emergency |
Water Treatment Plants
| Plant Name |
Permitted Capacity
(MGD) |
Is Raw Water Metered? |
Is Finished Water Ouput Metered? |
Source |
| City of Sanford WTP |
12.0000 |
Yes |
Yes |
Cape Fear River |
4. Wastewater Information
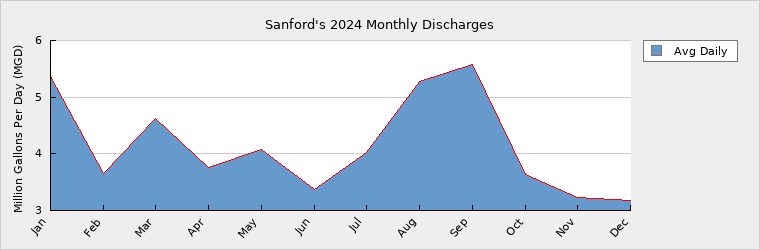
Monthly Discharges
|
Average Daily
Discharge (MGD) |
|
Average Daily
Discharge (MGD) |
|
Average Daily
Discharge (MGD) |
| Jan |
5.3600 |
May |
4.0680 |
Sep |
5.5750 |
| Feb |
3.6470 |
Jun |
3.3680 |
Oct |
3.6430 |
| Mar |
4.6270 |
Jul |
4.0240 |
Nov |
3.2350 |
| Apr |
3.7580 |
Aug |
5.2780 |
Dec |
3.1710 |
The City is exploring a 6 MGD expansion at Big Buffalo Water Reclamation Facility. Preliminary engineering has been completed and a speculative limits from DWR received. We will be starting design in the next 2 years. Wastewater Permits
| Permit Number |
Type |
Permitted Capacity
(MGD) |
Design Capacity
(MGD) |
Average Annual
Daily Discharge
(MGD) |
Maximum Day Discharge
(MGD) |
Receiving Stream |
Receiving Basin |
| NC0024147 |
WWTP |
12.0000 |
12.0000 |
4.1460 |
19.9620 |
Deep River |
Deep River (02-2) |
| WQ0000543 |
WWTP |
0.0000 |
0.0000 |
0.0163 |
|
various - sludge |
Deep River (02-2) |
| WQ0020248 |
WWTP |
1.0080 |
1.0080 |
0.0076 |
|
City of Sanford Golf Course |
Deep River (02-2) |
Wastewater Interconnections
| Water System |
PWSID |
Type |
Average Daily Amount |
Contract
Maximum (MGD) |
| MGD |
Days Used |
| Goldston Gulf |
03-19-025 |
Receiving |
0.0300 |
365 |
0.0650 |
5. Planning
Projections
| |
2024 |
2030 |
2040 |
2050 |
2060 |
2070 |
| Year-Round Population |
53,833 |
55,305 |
63,601 |
73,141 |
84,112 |
85,794 |
| Seasonal Population |
0 |
0 |
0 |
0 |
0 |
0 |
| |
| Residential |
2.2200 |
2.3800 |
2.7381 |
3.1488 |
3.6211 |
3.6008 |
| Commercial |
1.3600 |
1.5900 |
1.8270 |
2.0721 |
2.4865 |
2.9838 |
| Industrial |
0.4400 |
0.5580 |
0.6360 |
0.7150 |
0.8940 |
0.9730 |
| Institutional |
0.5500 |
0.5970 |
0.6210 |
0.6460 |
0.6720 |
0.6980 |
| System Process |
1.5600 |
1.4807 |
1.5547 |
1.6324 |
1.7141 |
1.8000 |
| Unaccounted-for |
0.8579 |
3.6596 |
3.8123 |
4.6635 |
5.0519 |
5.1457 |
Projected unaccounted-for demand was adjusted to 15% of total demand which is the historical median. Future Water Sales
| Purchaser |
PWSID |
Contract |
Pipe Size(s) (Inches) |
Use Type |
| MGD |
Year Begin |
Year End |
| Carolina Trace |
03-53-101 |
0.2000 |
2030 |
|
|
Regular |
| Fuquay-Varina |
03-92-055 |
6.0000 |
2026 |
2044 |
36 |
Regular |
| Fuquay-Varina |
03-92-055 |
8.0000 |
2045 |
2049 |
36 |
Regular |
| Fuquay-Varina |
03-92-055 |
10.0000 |
2050 |
2054 |
36 |
Regular |
| Fuquay-Varina |
03-92-055 |
11.0000 |
2055 |
|
36 |
Regular |
| Holly Springs |
03-92-010 |
4.0000 |
2026 |
|
36 |
Regular |
| Pittsboro |
03-19-015 |
2.0000 |
2027 |
|
24 |
Regular |
Sanford, Fuquay-Varina, and Holly Springs have partnered in the construction of an 18 mgd expansion at the Sanford Water Plant and will continue to expand the facility as the need arises.
Future Supply Sources
| Source Name |
PWSID |
Source Type |
Additional Supply |
Year Online |
Year Offline |
Type |
| Cape Fear River |
03-53-010 |
Surface |
18.0000 |
2026 |
|
Regular |
| Cape Fear River |
03-53-010 |
Surface |
12.0000 |
2040 |
|
Regular |
| Cape Fear River |
03-53-010 |
Surface |
6.0000 |
2060 |
|
Regular |
Demand v/s Percent of Supply
| |
2024 |
2030 |
2040 |
2050 |
2060 |
2070 |
| Surface Water Supply |
12.6000 |
12.6000 |
12.6000 |
12.6000 |
12.6000 |
12.6000 |
| Ground Water Supply |
0.0000 |
0.0000 |
0.0000 |
0.0000 |
0.0000 |
0.0000 |
| Purchases |
0.0000 |
0.0000 |
0.0000 |
0.0000 |
0.0000 |
0.0000 |
| Future Supplies |
18.0000 |
30.0000 |
30.0000 |
36.0000 |
36.0000 |
| Total Available Supply (MGD) |
12.6000 |
30.6000 |
42.6000 |
42.6000 |
48.6000 |
48.6000 |
| Service Area Demand |
6.9879 |
10.2653 |
11.1891 |
12.8778 |
14.4396 |
15.2013 |
| Sales |
0.9474 |
2.3390 |
2.3390 |
2.3390 |
2.3390 |
2.3390 |
| Future Sales |
12.2000 |
12.2000 |
16.2000 |
17.2000 |
17.2000 |
| Total Demand (MGD) |
7.9353 |
24.8043 |
25.7281 |
31.4168 |
33.9786 |
34.7403 |
| Demand as Percent of Supply |
63% |
81% |
60% |
74% |
70% |
71% |

The purpose of the above chart is to show a general indication of how the long-term per capita water demand changes over time. The per capita water demand may actually be different than indicated due to seasonal populations and the accuracy of data submitted. Water systems that have calculated long-term per capita water demand based on a methodology that produces different results may submit their information in the notes field.
Your long-term water demand is 41 gallons per capita per day. What demand management practices do you plan to implement to reduce the per capita water demand (i.e. conduct regular water audits, implement a plumbing retrofit program, employ practices such as rainwater harvesting or reclaimed water)? If these practices are covered elsewhere in your plan, indicate where the practices are discussed here.
Are there other demand management practices you will implement to reduce your future supply needs?
What supplies other than the ones listed in future supplies are being considered to meet your future supply needs?
How does the water system intend to implement the demand management and supply planning components above?
Additional Information
Has this system participated in regional water supply or water use planning? Yes, The City participated in the Jordan Lake Partnership to develop a consolidated plan with regard to water requirements for its members. The City is also in discussions with the Western Intake Partners in how best to collaborate for future water supply needs for the region in the future. Additionally, the City is partnering with Fuquay-Varina and Holly Springs on a joint expansion of the Sanford water filtration facility.
What major water supply reports or studies were used for planning?
Please describe any other needs or issues regarding your water supply sources, any water system deficiencies or needed improvements (storage, treatment, etc.) or your ability to meet present and future water needs. Include both quantity and quality considerations, as well as financial, technical, managerial, permitting, and compliance issues:
The Division of Water Resources (DWR) provides the data contained within this
Local Water Supply Plan (LWSP) as a courtesy and service to our customers.
DWR staff does not field verify data. Neither DWR, nor any other party
involved in the preparation of this LWSP attests that the data is completely
free of errors and omissions. Furthermore, data users are cautioned that
LWSPs labeled PROVISIONAL have yet to be reviewed by DWR staff. Subsequent
review may result in significant revision. Questions regarding the accuracy
or limitations of usage of this data should be directed to the water system
and/or DWR.
|