|
The Division of Water Resources (DWR) provides the data contained within this
Local Water Supply Plan (LWSP) as a courtesy and service to our customers.
DWR staff does not field verify data. Neither DWR, nor any other party
involved in the preparation of this LWSP attests that the data is completely
free of errors and omissions. Furthermore, data users are cautioned that
LWSPs labeled PROVISIONAL have yet to be reviewed by DWR staff. Subsequent
review may result in significant revision. Questions regarding the accuracy
or limitations of usage of this data should be directed to the water system
and/or DWR.
1. System Information
Contact Information
Provisional
| Water System Name: |
Montgomery Co |
|
PWSID: |
03-62-010 |
| Mailing Address: | 724 Hydro Road
Mount Gilead, NC 27306 | Ownership: | County |
| |
| Contact Person: | Mike Criscoe | Title: | Public Works Director |
| Phone: | 910-571-2902 | Cell/Mobile: | -- |
Distribution System
| Line Type |
Size Range (Inches) |
Estimated % of lines |
| Asbestos Cement |
6, 16 |
3.86 % |
| Ductile Iron |
6-24 |
6.13 % |
| Galvanized Iron |
2 |
0.05 % |
| Other |
UKWN |
0.35 % |
| Polyvinyl Chloride |
2-12 |
89.61 % |
Programs
Water Conservation
The County manager and our engineers ( Wooten Company) have been talking with Richmond County and Handy Sanitary for the possibility of connecting with their systems for an emergency. 2. Water Use Information
Service Area
| Sub-Basin(s) | % of Service Population |
|---|
| Yadkin River (18-1) | 86 % |
| Deep River (02-2) | 10 % |
| Lumber River (09-1) | 3 % |
| Uwharrie River (18-3) | 1 % |
|
| County(s) | % of Service Population |
|---|
| Montgomery | 100 % |
|
Water Use by Type
| Type of Use |
Metered
Connections |
Metered
Average Use (MGD) |
Non-Metered
Connections |
Non-Metered
Estimated Use (MGD) |
| Residential |
6,000 |
0.5090 |
0 |
0.0000 |
| Commercial |
145 |
0.3560 |
0 |
0.0000 |
| Industrial |
0 |
0.0000 |
0 |
0.0000 |
| Institutional |
0 |
0.0000 |
0 |
0.0000 |
How much water was used for system processes (backwash, line cleaning, flushing, etc.)? 1.7000 MGD
Water Sales
| Purchaser |
PWSID |
Average
Daily Sold
(MGD) |
Days
Used |
Contract |
Required to
comply with water
use restrictions? |
Pipe Size(s)
(Inches) |
Use
Type |
| MGD |
Expiration |
Recurring |
| Carolina Forest |
03-62-106 |
0.0300 |
365 |
0.0500 |
2040 |
Yes |
Yes |
8 |
Regular |
| Town of Biscoe |
03-62-035 |
0.3470 |
365 |
0.9000 |
2045 |
Yes |
Yes |
16,12 |
Regular |
| Town of Candor |
03-62-030 |
0.1430 |
365 |
0.2700 |
2045 |
Yes |
Yes |
12, 8 |
Regular |
| Town of Mt Gilead |
03-62-015 |
0.1410 |
365 |
0.2800 |
2045 |
Yes |
Yes |
24,20 |
Regular |
| Town of Robbins |
03-63-015 |
0.2360 |
365 |
0.2500 |
2019 |
Yes |
Yes |
12 |
Regular |
| Town of Star |
03-62-025 |
0.1350 |
365 |
0.1300 |
2045 |
Yes |
Yes |
8, 12 |
Regular |
| Town of Troy |
03-62-020 |
0.5500 |
365 |
0.6000 |
2045 |
Yes |
Yes |
20,16 |
Regular |
| Wood Run |
03-62-107 |
0.1050 |
365 |
0.0500 |
2040 |
Yes |
Yes |
12 |
Regular |
The towns of Candor, Star, Biscoe, Troy and Mount Gilead all renewed contracts in 2005 for 40 years. Collectively they are not to exceed 60 MG per month.
Mount Gilead water sales contract amount was changed to 0.330 MGD to cover projected demand and accommodate the 2.0 MGD max sales amount the county is obligated to sell to Biscoe, Candor, Mount Gilead, Star, and Troy. 3. Water Supply Sources
Monthly Withdrawals & Purchases
|
Average Daily
Use (MGD) |
Max Day
Use (MGD) |
|
Average Daily
Use (MGD) |
Max Day
Use (MGD) |
|
Average Daily
Use (MGD) |
Max Day
Use (MGD) |
| Jan |
2.9900 |
3.6400 |
May |
2.7200 |
3.8100 |
Sep |
3.1400 |
3.5500 |
| Feb |
2.9900 |
3.6500 |
Jun |
3.0100 |
3.9900 |
Oct |
2.8900 |
3.2900 |
| Mar |
2.6100 |
4.0800 |
Jul |
3.0400 |
3.9200 |
Nov |
2.7900 |
3.2600 |
| Apr |
2.6700 |
3.3100 |
Aug |
3.1100 |
3.7900 |
Dec |
2.6700 |
3.0700 |

Surface Water Sources
| Stream |
Reservoir |
Average Daily Withdrawal |
Maximum Day
Withdrawal (MGD) |
Available Raw
Water Supply |
Usable On-Stream
Raw Water Supply
Storage (MG) |
| MGD |
Days Used |
MGD |
* Qualifier |
| Pee Dee River |
Lake Tillery |
3.0000 |
365 |
4.2900 |
6.0000 |
T |
6.0000 |
* Qualifier: C=Contract Amount, SY20=20-year Safe Yield, SY50=50-year Safe Yield, F=20% of 7Q10 or other instream flow requirement, CUA=Capacity Use Area Permit
Surface Water Sources (continued)
| Stream |
Reservoir |
Drainage Area
(sq mi) |
Metered? |
Sub-Basin |
County |
Year
Offline |
Use
Type |
| Pee Dee River |
Lake Tillery |
4,600 |
Yes |
Yadkin River (18-1) |
Montgomery |
|
Regular |
Water Purchases From Other Systems
| Seller |
PWSID |
Average
Daily Purchased
(MGD) |
Days
Used |
Contract |
Required to
comply with water
use restrictions? |
Pipe Size(s)
(Inches) |
Use
Type |
| MGD |
Expiration |
Recurring |
| Carolina Forest |
03-62-106 |
0.0000 |
0 |
|
|
Yes |
Yes |
|
Emergency |
| Town of Biscoe |
03-62-035 |
0.0000 |
0 |
|
|
Yes |
Yes |
|
Emergency |
| Town of Candor |
03-62-030 |
0.0000 |
0 |
|
|
Yes |
Yes |
|
Emergency |
| Town of Mt.Gilead |
03-62-015 |
0.0000 |
0 |
|
|
Yes |
Yes |
|
Emergency |
| Town of Robbins |
03-63-015 |
0.0000 |
0 |
|
|
Yes |
Yes |
12 |
Emergency |
| Town of Star |
03-62-025 |
0.0000 |
0 |
|
|
Yes |
Yes |
|
Emergency |
| Town of Troy |
03-62-020 |
0.1398 |
365 |
0.0000 |
2025 |
Yes |
Yes |
8 |
Regular |
| Woodrun |
03-62-107 |
0.0000 |
0 |
|
|
Yes |
Yes |
|
Emergency |
The amount of water purchased from the Town of Troy was adjusted from 0.5638 MGD to 0.1398 MGD which is the estimated amount of water used by county customers supplied by Troy. Water Treatment Plants
| Plant Name |
Permitted Capacity
(MGD) |
Is Raw Water Metered? |
Is Finished Water Ouput Metered? |
Source |
| Montgomery County WTP |
6.0000 |
Yes |
Yes |
Lake Tillery |
4. Wastewater Information
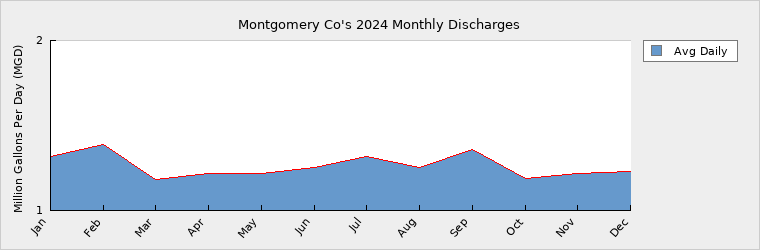
Monthly Discharges
|
Average Daily
Discharge (MGD) |
|
Average Daily
Discharge (MGD) |
|
Average Daily
Discharge (MGD) |
| Jan |
1.3200 |
May |
1.2200 |
Sep |
1.3600 |
| Feb |
1.3900 |
Jun |
1.2500 |
Oct |
1.1900 |
| Mar |
1.1800 |
Jul |
1.3200 |
Nov |
1.2200 |
| Apr |
1.2200 |
Aug |
1.2500 |
Dec |
1.2300 |
Today there are no plan for expansion Wastewater Permits
| Permit Number |
Type |
Permitted Capacity
(MGD) |
Design Capacity
(MGD) |
Average Annual
Daily Discharge
(MGD) |
Maximum Day Discharge
(MGD) |
Receiving Stream |
Receiving Basin |
| NC0080322 |
WTP |
0.2880 |
0.3800 |
0.0115 |
0.5650 |
Unamed Trib. to Clarks Creek |
Yadkin River (18-1) |
Wastewater Interconnections
| Water System |
PWSID |
Type |
Average Daily Amount |
Contract
Maximum (MGD) |
| MGD |
Days Used |
| Town of Candor |
03-62-030 |
Discharging |
0.0380 |
365 |
|
| Town of Troy |
03-62-020 |
Discharging |
0.0030 |
365 |
|
5. Planning
Projections
| |
2024 |
2030 |
2040 |
2050 |
2060 |
2070 |
| Year-Round Population |
14,710 |
15,004 |
15,304 |
15,610 |
15,922 |
16,240 |
| Seasonal Population |
0 |
0 |
0 |
0 |
0 |
0 |
| |
| Residential |
0.5090 |
0.0010 |
0.0010 |
0.0010 |
0.0010 |
0.0010 |
| Commercial |
0.3560 |
0.1520 |
0.1620 |
0.1720 |
0.1820 |
0.1920 |
| Industrial |
0.0000 |
0.0000 |
0.0000 |
0.0000 |
0.0000 |
0.0000 |
| Institutional |
0.0000 |
0.0000 |
0.0000 |
0.0000 |
0.0000 |
0.0000 |
| System Process |
1.7000 |
15.5000 |
15.5000 |
15.5000 |
15.5000 |
15.5000 |
| Unaccounted-for |
-1.1162 |
1.0000 |
1.0000 |
1.0000 |
1.0000 |
1.0000 |
Demand v/s Percent of Supply
| |
2024 |
2030 |
2040 |
2050 |
2060 |
2070 |
| Surface Water Supply |
6.0000 |
6.0000 |
6.0000 |
6.0000 |
6.0000 |
6.0000 |
| Ground Water Supply |
0.0000 |
0.0000 |
0.0000 |
0.0000 |
0.0000 |
0.0000 |
| Purchases |
0.1398 |
0.1398 |
0.1398 |
0.1398 |
0.1398 |
0.1398 |
| Future Supplies |
0.0000 |
0.0000 |
0.0000 |
0.0000 |
0.0000 |
| Total Available Supply (MGD) |
6.1398 |
6.1398 |
6.1398 |
6.1398 |
6.1398 |
6.1398 |
| Service Area Demand |
1.4488 |
16.6530 |
16.6630 |
16.6730 |
16.6830 |
16.6930 |
| Sales |
1.6824 |
2.5900 |
2.5900 |
2.5900 |
2.5900 |
2.5900 |
| Future Sales |
0.0000 |
0.0000 |
0.0000 |
0.0000 |
0.0000 |
| Total Demand (MGD) |
3.1312 |
19.2430 |
19.2530 |
19.2630 |
19.2730 |
19.2830 |
| Demand as Percent of Supply |
51% |
313% |
314% |
314% |
314% |
314% |

The purpose of the above chart is to show a general indication of how the long-term per capita water demand changes over time. The per capita water demand may actually be different than indicated due to seasonal populations and the accuracy of data submitted. Water systems that have calculated long-term per capita water demand based on a methodology that produces different results may submit their information in the notes field.
Your long-term water demand is 35 gallons per capita per day. What demand management practices do you plan to implement to reduce the per capita water demand (i.e. conduct regular water audits, implement a plumbing retrofit program, employ practices such as rainwater harvesting or reclaimed water)? If these practices are covered elsewhere in your plan, indicate where the practices are discussed here.
Are there other demand management practices you will implement to reduce your future supply needs?
What supplies other than the ones listed in future supplies are being considered to meet your future supply needs?
How does the water system intend to implement the demand management and supply planning components above?
Additional Information
Has this system participated in regional water supply or water use planning? No
What major water supply reports or studies were used for planning?
Please describe any other needs or issues regarding your water supply sources, any water system deficiencies or needed improvements (storage, treatment, etc.) or your ability to meet present and future water needs. Include both quantity and quality considerations, as well as financial, technical, managerial, permitting, and compliance issues:
The Division of Water Resources (DWR) provides the data contained within this
Local Water Supply Plan (LWSP) as a courtesy and service to our customers.
DWR staff does not field verify data. Neither DWR, nor any other party
involved in the preparation of this LWSP attests that the data is completely
free of errors and omissions. Furthermore, data users are cautioned that
LWSPs labeled PROVISIONAL have yet to be reviewed by DWR staff. Subsequent
review may result in significant revision. Questions regarding the accuracy
or limitations of usage of this data should be directed to the water system
and/or DWR.
|