|
The Division of Water Resources (DWR) provides the data contained within this
Local Water Supply Plan (LWSP) as a courtesy and service to our customers.
DWR staff does not field verify data. Neither DWR, nor any other party
involved in the preparation of this LWSP attests that the data is completely
free of errors and omissions. Furthermore, data users are cautioned that
LWSPs labeled PROVISIONAL have yet to be reviewed by DWR staff. Subsequent
review may result in significant revision. Questions regarding the accuracy
or limitations of usage of this data should be directed to the water system
and/or DWR.
1. System Information
Contact Information
Complete
| Water System Name: |
Southern Pines |
|
PWSID: |
03-63-010 |
| Mailing Address: | 801 SE Service Rd
Southern Pines, NC 28387 | Ownership: | Municipality |
| |
| Contact Person: | Ron Istre | Title: | Utilities Superintendent |
| Phone: | 910-692-1983 | Cell/Mobile: | 618-979-1678 |
Distribution System
| Line Type |
Size Range (Inches) |
Estimated % of lines |
| Asbestos Cement |
6-12 |
9.00 % |
| Cast Iron |
1-12 |
37.00 % |
| Ductile Iron |
6-18 |
2.00 % |
| Galvanized Iron |
2 |
6.00 % |
| Other |
1-16 |
4.00 % |
| Polyvinyl Chloride |
2-12 |
42.00 % |
Programs
Water Conservation
2. Water Use Information
Service Area
| Sub-Basin(s) | % of Service Population |
|---|
| Lumber River (09-1) | 0 % |
| Cape Fear River (02-3) | 0 % |
|
| County(s) | % of Service Population |
|---|
| Moore | 0 % |
|
Water Use by Type
| Type of Use |
Metered
Connections |
Metered
Average Use (MGD) |
Non-Metered
Connections |
Non-Metered
Estimated Use (MGD) |
| Residential |
6,014 |
1.0900 |
0 |
0.0000 |
| Commercial |
810 |
0.7400 |
0 |
0.0000 |
| Industrial |
9 |
0.0100 |
0 |
0.0000 |
| Institutional |
142 |
0.0500 |
0 |
0.0000 |
How much water was used for system processes (backwash, line cleaning, flushing, etc.)? 0.1530 MGD
Water Sales
| Purchaser |
PWSID |
Average
Daily Sold
(MGD) |
Days
Used |
Contract |
Required to
comply with water
use restrictions? |
Pipe Size(s)
(Inches) |
Use
Type |
| MGD |
Expiration |
Recurring |
| Aberdeen |
03-63-020 |
0.0000 |
0 |
0.5000 |
2008 |
|
|
8 |
Emergency |
| Camp Mackall |
03-63-617 |
0.0300 |
365 |
0.0000 |
|
|
|
6 |
Regular |
| Moore Co - Addor |
03-63-153 |
0.0070 |
365 |
0.0000 |
2003 |
|
|
6 |
Regular |
| Moore Co - Carolina |
03-63-152 |
0.0240 |
365 |
0.0000 |
2003 |
|
|
6 |
Regular |
| Moore Co - Pinehurst |
03-63-108 |
0.3820 |
365 |
0.7500 |
2003 |
|
|
8 |
Regular |
| Oakwood Hills |
03-63-151 |
0.0100 |
365 |
0.0000 |
|
|
|
6 |
Regular |
| Whispering Pines |
03-63-112 |
0.2200 |
365 |
0.2000 |
|
|
|
8 |
Regular |
Moore Co-Addor average daily sales amount was adjusted to 0.007 MGD based on Moore Co- Addor usage numbers; adjustments necessary due to a reported meter malfunction.
All of the Moore Co Systems (Pinehurst, Addor and Carolina) are under one Contract Amount of 0.75 MGD.
Total Amount of Sales Contracts for Regular Use is 0.99 MGD.(0.01 + 0.03 + 0.20 + 0.75).
The update formula is adding in the 0.50 MGD Emergency Use contract. The update formula is also adding Moore Co- Carolina 0.02 MGD and Moore Co- Addor 0.007 MGD, which is included in the 0.75 MGD sales contract. 3. Water Supply Sources
Monthly Withdrawals & Purchases
|
Average Daily
Use (MGD) |
Max Day
Use (MGD) |
|
Average Daily
Use (MGD) |
Max Day
Use (MGD) |
|
Average Daily
Use (MGD) |
Max Day
Use (MGD) |
| Jan |
2.6300 |
3.2200 |
May |
4.0700 |
5.1800 |
Sep |
2.8000 |
4.3200 |
| Feb |
2.7500 |
3.6800 |
Jun |
4.8100 |
5.7100 |
Oct |
3.1300 |
4.1300 |
| Mar |
2.8200 |
3.5200 |
Jul |
3.7400 |
4.9100 |
Nov |
2.7300 |
3.4100 |
| Apr |
3.5400 |
4.5700 |
Aug |
2.6200 |
4.5500 |
Dec |
2.5000 |
3.2100 |

Ground Water Sources
| Name or Number |
Average Daily Withdrawal (MGD) |
Max Day Withdrawal (MGD) |
12-Hour Supply
(MGD) |
CUA Reduction |
Year Offline |
Use Type |
| MGD |
Days Used |
| No. 1 - Weymouth |
0.1200 |
10 |
0.120 |
0.1200 |
|
|
Regular |
| No. 2 - Henley |
0.1500 |
10 |
0.150 |
0.1500 |
|
|
Regular |
| No. 4 - Douglas Center |
0.1200 |
10 |
0.120 |
0.1200 |
|
|
Regular |
Ground Water Sources (continued)
| Name or Number |
Well Depth (Feet) |
Casing Depth
(Feet) |
Screen Depth (Feet) |
Well Diameter (Inches) |
Pump Intake Depth (Feet) |
Metered? |
| Top |
Bottom |
| No. 1 - Weymouth |
250 |
250 |
180 |
220 |
10 |
231 |
Yes |
| No. 2 - Henley |
250 |
250 |
180 |
220 |
10 |
231 |
Yes |
| No. 4 - Douglas Center |
180 |
170 |
120 |
160 |
10 |
150 |
Yes |
These were old wells that were not in service. They were rehabilitated and put back into service during the latter part of 2002, as a direct result of the drought. These wells have since been maintained as regular use wells. Surface Water Sources
| Stream |
Reservoir |
Average Daily Withdrawal |
Maximum Day
Withdrawal (MGD) |
Available Raw
Water Supply |
Usable On-Stream
Raw Water Supply
Storage (MG) |
| MGD |
Days Used |
MGD |
* Qualifier |
| Drowning Creek |
|
3.1800 |
365 |
5.7100 |
8.0000 |
F |
0.0000 |
* Qualifier: C=Contract Amount, SY20=20-year Safe Yield, SY50=50-year Safe Yield, F=20% of 7Q10 or other instream flow requirement, CUA=Capacity Use Area Permit
Surface Water Sources (continued)
| Stream |
Reservoir |
Drainage Area
(sq mi) |
Metered? |
Sub-Basin |
County |
Year
Offline |
Use
Type |
| Drowning Creek |
|
178 |
Yes |
Lumber River (09-1) |
Moore |
|
Regular |
Water Purchases From Other Systems
| Seller |
PWSID |
Average
Daily Purchased
(MGD) |
Days
Used |
Contract |
Required to
comply with water
use restrictions? |
Pipe Size(s)
(Inches) |
Use
Type |
| MGD |
Expiration |
Recurring |
| Aberdeen |
03-63-020 |
0.0000 |
0 |
0.5000 |
2008 |
|
|
8 |
Emergency |
Water Treatment Plants
| Plant Name |
Permitted Capacity
(MGD) |
Is Raw Water Metered? |
Is Finished Water Ouput Metered? |
Source |
| Southern Pines |
8.0000 |
Yes |
Yes |
Drowning Creek |
4. Wastewater Information
Monthly Discharges
|
Average Daily
Discharge (MGD) |
|
Average Daily
Discharge (MGD) |
|
Average Daily
Discharge (MGD) |
| Jan |
0.1450 |
May |
0.1990 |
Sep |
0.1600 |
| Feb |
0.1270 |
Jun |
0.1770 |
Oct |
0.1510 |
| Mar |
0.1530 |
Jul |
0.1210 |
Nov |
0.1620 |
| Apr |
0.1820 |
Aug |
0.1090 |
Dec |
0.1430 |
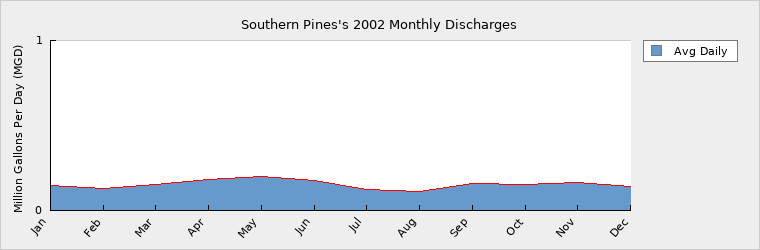
Average daily wastewater discharge amounts only include backwash from the water treatment plant; the values do not reflect the total average daily (1.210 MGD) discharged to Moore Co Public Utilities WWTP. Wastewater Permits
| Permit Number |
Type |
Permitted Capacity
(MGD) |
Design Capacity
(MGD) |
Average Annual
Daily Discharge
(MGD) |
Maximum Day Discharge
(MGD) |
Receiving Stream |
Receiving Basin |
| NC0037508 |
|
6.7000 |
6.7000 |
4.3380 |
5.0510 |
Aberdeen Creek |
Lumber River (09-1) |
| NC0049778 |
|
0.2000 |
0.2300 |
0.1520 |
0.2040 |
Aberdeen Creek |
Lumber River (09-1) |
NC0037508 - This plant is owned by Moore Co & serves municipalities other than Southern Pines.
NC0049778 - Backwash water discharge from the water treatment plant. Wastewater Interconnections
| Water System |
PWSID |
Type |
Average Daily Amount |
Contract
Maximum (MGD) |
| MGD |
Days Used |
| Moore Co Public Utilities |
03-63-108 |
Discharging |
1.2100 |
365 |
0.0000 |
5. Planning
Projections
| |
2002 |
2010 |
2020 |
2030 |
| Year-Round Population |
13,120 |
15,221 |
17,689 |
20,140 |
| Seasonal Population |
0 |
0 |
0 |
0 |
| |
| Residential |
1.0900 |
1.2600 |
1.4700 |
1.6700 |
| Commercial |
0.7400 |
0.8700 |
1.0600 |
1.2900 |
| Industrial |
0.0100 |
0.0100 |
0.0100 |
0.0200 |
| Institutional |
0.0500 |
0.0600 |
0.0700 |
0.0900 |
| System Process |
0.1530 |
0.1800 |
0.2200 |
0.2700 |
| Unaccounted-for |
0.4747 |
0.5500 |
0.6500 |
0.7250 |
Future Water Sales
| Purchaser |
PWSID |
Contract |
Pipe Size(s) (Inches) |
Use Type |
| MGD |
Year Begin |
Year End |
| Moore County - East Moore |
50-63-011 |
0.0000 |
|
|
|
Regular |
| Town of Carthage |
03-63-025 |
0.5000 |
2003 |
2008 |
8 |
Emergency |
The Contract Amount has not been determined for Moore County - East Moore. Future Supply Sources
| Source Name |
PWSID |
Source Type |
Additional Supply |
Year Online |
Year Offline |
Type |
| Carthage |
03-63-025 |
Purchase |
0.5000 |
2003 |
|
Emergency |
| Moore Co- East Moore |
50-63-011 |
Purchase |
0.0000 |
|
|
Emergency |
The Contract Amount has not been determined for Moore Co- East Moore. Demand v/s Percent of Supply
| |
2002 |
2010 |
2020 |
2030 |
| Surface Water Supply |
8.0000 |
8.0000 |
8.0000 |
8.0000 |
| Ground Water Supply |
0.3900 |
0.3900 |
0.3900 |
0.3900 |
| Purchases |
0.0000 |
0.0000 |
0.0000 |
0.0000 |
| Future Supplies |
0.0000 |
0.0000 |
0.0000 |
| Total Available Supply (MGD) |
8.3900 |
8.3900 |
8.3900 |
8.3900 |
| Service Area Demand |
2.5177 |
2.9300 |
3.4800 |
4.0650 |
| Sales |
0.6730 |
0.2600 |
0.2600 |
0.2600 |
| Future Sales |
0.0000 |
0.0000 |
0.0000 |
| Total Demand (MGD) |
3.1907 |
3.1900 |
3.7400 |
4.3250 |
| Demand as Percent of Supply |
38% |
38% |
45% |
52% |

The purpose of the above chart is to show a general indication of how the long-term per capita water demand changes over time. The per capita water demand may actually be different than indicated due to seasonal populations and the accuracy of data submitted. Water systems that have calculated long-term per capita water demand based on a methodology that produces different results may submit their information in the notes field.
Your long-term water demand is 83 gallons per capita per day. What demand management practices do you plan to implement to reduce the per capita water demand (i.e. conduct regular water audits, implement a plumbing retrofit program, employ practices such as rainwater harvesting or reclaimed water)? If these practices are covered elsewhere in your plan, indicate where the practices are discussed here.
Are there other demand management practices you will implement to reduce your future supply needs?
What supplies other than the ones listed in future supplies are being considered to meet your future supply needs?
How does the water system intend to implement the demand management and supply planning components above?
Additional Information
Has this system participated in regional water supply or water use planning? Yes
What major water supply reports or studies were used for planning? Town of Southern Pines Water Treatment Plant Evaluation - 1998 by Hobbs, Upchurch & Associates, PA, Southern Pines, NC.
Please describe any other needs or issues regarding your water supply sources, any water system deficiencies or needed improvements (storage, treatment, etc.) or your ability to meet present and future water needs. Include both quantity and quality considerations, as well as financial, technical, managerial, permitting, and compliance issues: Need Raw Water Storage for low flow at creek; Increase finish water storage and pumping ability; Interconnection with Carthage to provide Emergency water for either system.
The Division of Water Resources (DWR) provides the data contained within this
Local Water Supply Plan (LWSP) as a courtesy and service to our customers.
DWR staff does not field verify data. Neither DWR, nor any other party
involved in the preparation of this LWSP attests that the data is completely
free of errors and omissions. Furthermore, data users are cautioned that
LWSPs labeled PROVISIONAL have yet to be reviewed by DWR staff. Subsequent
review may result in significant revision. Questions regarding the accuracy
or limitations of usage of this data should be directed to the water system
and/or DWR.
|