|
The Division of Water Resources (DWR) provides the data contained within this
Local Water Supply Plan (LWSP) as a courtesy and service to our customers.
DWR staff does not field verify data. Neither DWR, nor any other party
involved in the preparation of this LWSP attests that the data is completely
free of errors and omissions. Furthermore, data users are cautioned that
LWSPs labeled PROVISIONAL have yet to be reviewed by DWR staff. Subsequent
review may result in significant revision. Questions regarding the accuracy
or limitations of usage of this data should be directed to the water system
and/or DWR.
1. System Information
Contact Information
Complete
| Water System Name: |
Aberdeen |
|
PWSID: |
03-63-020 |
| Mailing Address: | PO Box 785
Aberdeen, NC 28315 | Ownership: | Municipality |
| |
| Contact Person: | Joe Wood | Title: | Public Works Director |
| Phone: | 910-944-4523 | Cell/Mobile: | 910-690-4193 |
| |
| Secondary Contact: | Eric Honrine | | Phone: | 910-944-4526 |
| Mailing Address: | PO Box 785
Aberdeen, NC 28315 | Cell/Mobile: | 910-690-4193 |
Distribution System
| Line Type |
Size Range (Inches) |
Estimated % of lines |
| Asbestos Cement |
6-10 |
20.00 % |
| Cast Iron |
6-8 |
19.00 % |
| Ductile Iron |
6-14 |
16.00 % |
| Polyvinyl Chloride |
6-12 |
45.00 % |
Programs
Water Conservation
2. Water Use Information
Service Area
| Sub-Basin(s) | % of Service Population |
|---|
| Lumber River (09-1) | 100 % |
|
| County(s) | % of Service Population |
|---|
| Moore | 100 % |
|
Water Use by Type
| Type of Use |
Metered
Connections |
Metered
Average Use (MGD) |
Non-Metered
Connections |
Non-Metered
Estimated Use (MGD) |
| Residential |
4,442 |
0.5984 |
0 |
0.0000 |
| Commercial |
484 |
0.2381 |
0 |
0.0000 |
| Industrial |
26 |
0.0282 |
0 |
0.0000 |
| Institutional |
64 |
0.0740 |
0 |
0.0000 |
How much water was used for system processes (backwash, line cleaning, flushing, etc.)? 0.0300 MGD
Water Sales
| Purchaser |
PWSID |
Average
Daily Sold
(MGD) |
Days
Used |
Contract |
Required to
comply with water
use restrictions? |
Pipe Size(s)
(Inches) |
Use
Type |
| MGD |
Expiration |
Recurring |
| Hoke County |
03-47-025 |
0.0414 |
167 |
0.0000 |
2026 |
Yes |
Yes |
8 |
Emergency |
| Moore Co (Pinehurst) |
03-63-108 |
0.7595 |
77 |
0.6000 |
2029 |
Yes |
Yes |
10 |
Regular |
Amounts and days sold to Hoke County as reported have been checked and verified. 3. Water Supply Sources
Monthly Withdrawals & Purchases
|
Average Daily
Use (MGD) |
Max Day
Use (MGD) |
|
Average Daily
Use (MGD) |
Max Day
Use (MGD) |
|
Average Daily
Use (MGD) |
Max Day
Use (MGD) |
| Jan |
0.8787 |
1.3020 |
May |
1.1167 |
1.3850 |
Sep |
1.4108 |
2.5960 |
| Feb |
0.8539 |
1.1470 |
Jun |
1.9959 |
3.1060 |
Oct |
1.1440 |
1.5460 |
| Mar |
0.8965 |
1.1640 |
Jul |
2.0486 |
3.0520 |
Nov |
0.9761 |
1.2940 |
| Apr |
1.0500 |
1.4320 |
Aug |
1.6550 |
3.0030 |
Dec |
0.8753 |
1.3730 |
Extremely High Maximum Days Reported were due to having two of our high producing wells down for maintenance. 
Ground Water Sources
| Name or Number |
Average Daily Withdrawal (MGD) |
Max Day Withdrawal (MGD) |
12-Hour Supply
(MGD) |
CUA Reduction |
Year Offline |
Use Type |
| MGD |
Days Used |
| 10 |
0.0560 |
365 |
|
0.1094 |
|
|
Regular |
| 11 |
0.0890 |
365 |
|
0.1987 |
|
|
Regular |
| 12 |
0.0467 |
365 |
|
0.1540 |
|
|
Regular |
| 13 |
0.0616 |
365 |
|
0.1447 |
|
|
Regular |
| 14 |
0.1104 |
365 |
|
0.2512 |
|
|
Regular |
| 15 |
0.0411 |
365 |
|
0.0792 |
|
|
Regular |
| 16 |
0.0958 |
365 |
|
0.1670 |
|
|
Regular |
| 17 |
0.1006 |
365 |
|
0.1836 |
|
|
Regular |
| 18 |
0.0701 |
365 |
|
0.1224 |
|
|
Regular |
| 19 |
0.0602 |
365 |
|
0.0720 |
|
|
Regular |
| 22 |
0.0663 |
365 |
|
0.0778 |
|
|
Regular |
| 28 |
0.0696 |
365 |
|
0.1072 |
|
|
Regular |
| 3 |
0.1380 |
365 |
|
0.1620 |
|
|
Regular |
| 6 |
0.0933 |
365 |
|
0.1684 |
|
|
Regular |
| 7 |
0.0738 |
365 |
|
0.1728 |
|
|
Regular |
| 8 |
0.0728 |
365 |
|
0.1857 |
|
|
Regular |
Ground Water Sources (continued)
| Name or Number |
Well Depth (Feet) |
Casing Depth
(Feet) |
Screen Depth (Feet) |
Well Diameter (Inches) |
Pump Intake Depth (Feet) |
Metered? |
| Top |
Bottom |
| 10 |
200 |
30 |
100 |
145 |
10 |
|
Yes |
| 11 |
150 |
0 |
104 |
144 |
10 |
96 |
Yes |
| 12 |
191 |
40 |
129 |
179 |
10 |
118 |
Yes |
| 13 |
188 |
0 |
126 |
176 |
10 |
124 |
Yes |
| 14 |
190 |
0 |
130 |
185 |
10 |
|
Yes |
| 15 |
160 |
30 |
100 |
145 |
10 |
66 |
Yes |
| 16 |
270 |
0 |
210 |
260 |
10 |
|
Yes |
| 17 |
260 |
0 |
195 |
250 |
8 |
|
Yes |
| 18 |
286 |
165 |
165 |
203 |
8 |
170 |
Yes |
| 19 |
100 |
67 |
67 |
82 |
10 |
75 |
Yes |
| 22 |
160 |
92 |
107 |
156 |
6 |
126 |
Yes |
| 28 |
235 |
50 |
140 |
225 |
15 |
|
Yes |
| 3 |
154 |
96 |
96 |
143 |
8 |
84 |
Yes |
| 6 |
190 |
96 |
96 |
188 |
10 |
129 |
Yes |
| 7 |
140 |
30 |
80 |
120 |
10 |
80 |
Yes |
| 8 |
140 |
30 |
100 |
175 |
10 |
126 |
Yes |
Water Purchases From Other Systems
| Seller |
PWSID |
Average
Daily Purchased
(MGD) |
Days
Used |
Contract |
Required to
comply with water
use restrictions? |
Pipe Size(s)
(Inches) |
Use
Type |
| MGD |
Expiration |
Recurring |
| Moore Co (Pinehurst) |
03-63-108 |
0.0000 |
0 |
0.0000 |
2029 |
Yes |
Yes |
10 |
Emergency |
| Southern Pines |
03-63-010 |
0.0000 |
0 |
0.5000 |
2053 |
Yes |
Yes |
8 |
Emergency |
4. Wastewater Information
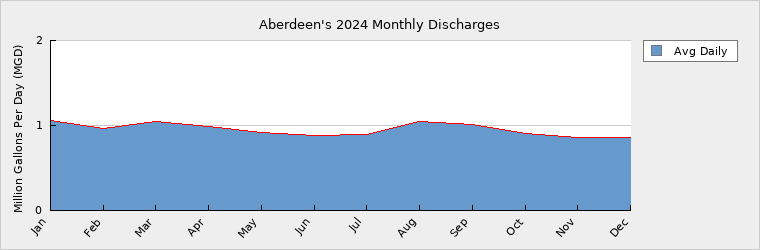
Monthly Discharges
|
Average Daily
Discharge (MGD) |
|
Average Daily
Discharge (MGD) |
|
Average Daily
Discharge (MGD) |
| Jan |
1.0621 |
May |
0.9194 |
Sep |
1.0120 |
| Feb |
0.9626 |
Jun |
0.8787 |
Oct |
0.9000 |
| Mar |
1.0464 |
Jul |
0.8910 |
Nov |
0.8565 |
| Apr |
0.9850 |
Aug |
1.0454 |
Dec |
0.8645 |
Wastewater Interconnections
| Water System |
PWSID |
Type |
Average Daily Amount |
Contract
Maximum (MGD) |
| MGD |
Days Used |
| Moore County Public Utilities |
03-63-108 |
Discharging |
0.9520 |
365 |
0.4000 |
| Southern Pines |
03-63-010 |
Discharging |
0.0279 |
366 |
|
The amount discharged to Southern Pines (0.0279 MGD) was taken directly from our billing system. It was checked and verified. 5. Planning
Projections
| |
2024 |
2030 |
2040 |
2050 |
2060 |
2070 |
| Year-Round Population |
12,241 |
14,300 |
15,730 |
17,303 |
19,033 |
20,937 |
| Seasonal Population |
0 |
0 |
0 |
0 |
0 |
0 |
| |
| Residential |
0.5984 |
0.6864 |
0.7236 |
0.7786 |
0.8565 |
0.9422 |
| Commercial |
0.2381 |
0.2350 |
0.2400 |
0.2448 |
0.2497 |
0.2547 |
| Industrial |
0.0282 |
0.0300 |
0.0300 |
0.0300 |
0.0300 |
0.0300 |
| Institutional |
0.0740 |
0.0750 |
0.0765 |
0.0780 |
0.0796 |
0.0812 |
| System Process |
0.0300 |
0.0310 |
0.0313 |
0.0316 |
0.0319 |
0.0322 |
| Unaccounted-for |
0.0945 |
0.0847 |
0.0965 |
0.1051 |
0.1492 |
0.1561 |
Future Supply Sources
| Source Name |
PWSID |
Source Type |
Additional Supply |
Year Online |
Year Offline |
Type |
| Aberdeen |
03-63-020 |
Ground |
0.1080 |
2026 |
|
Regular |
| Aberdeen |
03-63-020 |
Ground |
0.1080 |
2028 |
|
Regular |
| Aberdeen |
03-63-020 |
Ground |
0.1080 |
2029 |
|
Regular |
| Aberdeen |
03-63-020 |
Ground |
0.1080 |
2030 |
|
Regular |
Demand v/s Percent of Supply
| |
2024 |
2030 |
2040 |
2050 |
2060 |
2070 |
| Surface Water Supply |
0.0000 |
0.0000 |
0.0000 |
0.0000 |
0.0000 |
0.0000 |
| Ground Water Supply |
2.3561 |
2.3561 |
2.3561 |
2.3561 |
2.3561 |
2.3561 |
| Purchases |
0.0000 |
0.0000 |
0.0000 |
0.0000 |
0.0000 |
0.0000 |
| Future Supplies |
0.4320 |
0.4320 |
0.4320 |
0.4320 |
0.4320 |
| Total Available Supply (MGD) |
2.3561 |
2.7881 |
2.7881 |
2.7881 |
2.7881 |
2.7881 |
| Service Area Demand |
1.0632 |
1.1421 |
1.1979 |
1.2681 |
1.3969 |
1.4964 |
| Sales |
0.1787 |
0.8009 |
0.8009 |
0.8009 |
0.8009 |
0.8009 |
| Future Sales |
0.0000 |
0.0000 |
0.0000 |
0.0000 |
0.0000 |
| Total Demand (MGD) |
1.2419 |
1.9430 |
1.9988 |
2.0690 |
2.1978 |
2.2973 |
| Demand as Percent of Supply |
53% |
70% |
72% |
74% |
79% |
82% |

The purpose of the above chart is to show a general indication of how the long-term per capita water demand changes over time. The per capita water demand may actually be different than indicated due to seasonal populations and the accuracy of data submitted. Water systems that have calculated long-term per capita water demand based on a methodology that produces different results may submit their information in the notes field.
Your long-term water demand is 49 gallons per capita per day. What demand management practices do you plan to implement to reduce the per capita water demand (i.e. conduct regular water audits, implement a plumbing retrofit program, employ practices such as rainwater harvesting or reclaimed water)? If these practices are covered elsewhere in your plan, indicate where the practices are discussed here.
No changes
Are there other demand management practices you will implement to reduce your future supply needs? Just completed the final installation of AMI meters. Our new system allows us to identify and repair leakes faster. Continue to educate public on irrigation watering practices
What supplies other than the ones listed in future supplies are being considered to meet your future supply needs? In addition to the 2 projected wells to met future demand we will look to develop additional sites by 2050. Implementation of our AMU meter system we are reducing water loss by identifying leakes faster which will help reduce loss.
How does the water system intend to implement the demand management and supply planning components above? Reduce the amount of water sales to our bulk customers.
Additional Information
Has this system participated in regional water supply or water use planning? Yes
What major water supply reports or studies were used for planning? In the final stages of completion of our water system model in 2025. Complete AIA FY 25
Please describe any other needs or issues regarding your water supply sources, any water system deficiencies or needed improvements (storage, treatment, etc.) or your ability to meet present and future water needs. Include both quantity and quality considerations, as well as financial, technical, managerial, permitting, and compliance issues:
The Division of Water Resources (DWR) provides the data contained within this
Local Water Supply Plan (LWSP) as a courtesy and service to our customers.
DWR staff does not field verify data. Neither DWR, nor any other party
involved in the preparation of this LWSP attests that the data is completely
free of errors and omissions. Furthermore, data users are cautioned that
LWSPs labeled PROVISIONAL have yet to be reviewed by DWR staff. Subsequent
review may result in significant revision. Questions regarding the accuracy
or limitations of usage of this data should be directed to the water system
and/or DWR.
|