|
The Division of Water Resources (DWR) provides the data contained within this
Local Water Supply Plan (LWSP) as a courtesy and service to our customers.
DWR staff does not field verify data. Neither DWR, nor any other party
involved in the preparation of this LWSP attests that the data is completely
free of errors and omissions. Furthermore, data users are cautioned that
LWSPs labeled PROVISIONAL have yet to be reviewed by DWR staff. Subsequent
review may result in significant revision. Questions regarding the accuracy
or limitations of usage of this data should be directed to the water system
and/or DWR.
1. System Information
Contact Information
Complete
| Water System Name: |
Orange Water and Sewer Authority |
|
PWSID: |
03-68-010 |
| Mailing Address: | 400 Jones Ferry Road
Carrboro, NC 27510 | Ownership: | Authority |
| |
| Contact Person: | Kim Nimmer | Title: | Planning and Development Manager |
| Phone: | 919-537-4214 | Cell/Mobile: | -- |
Distribution System
| Line Type |
Size Range (Inches) |
Estimated % of lines |
| Asbestos Cement |
4-12 |
24.97 % |
| Cast Iron |
4-20 |
2.38 % |
| Ductile Iron |
2-42 |
66.42 % |
| Other |
1-20 |
1.10 % |
| Polyvinyl Chloride |
1-8 |
5.13 % |
Conversion to AMI infrastructure was completed in 2019. The oldest meter in the system is at the UNC Cogeneration Facility. Programs
All critical valves (12-inch and larger, approximately 1,300 in the system) are scheduled to be exercised annually. The remaining valves are exercised on a 5-year cycle.
OWASA inspects and repairs hydrants as needed. Additionally, local fire departments also inspect and operate hydrants annually.
While OWASA does not have a formal leak detection program, we use AWWA's Water Audit software to evaluate water loss in our system and report a monthly KPI on unaccounted-for water. Per the annual water audit, our water loss in FY 2024 was 16.9 gallons per connection.
As part of our affordability program, we perform water audits as requested and as resources allow. Our AMI software enables us to proactively let customers know when a leak may be occurring behind the meter. In CY 2024, the system provided our customers with 20,950 notifications of possible leaks. Water Conservation
Single-family residential rates are increasing block; multi-family rates are uniform based on analysis which indicated that the group does not exhibit a traditional peaking pattern; all other rates are seasonal. During droughts, drought surcharges apply to all rate types.
Reclaimed water (RCW) is used mainly by UNC and UNC Hospitals in cooling towers and for chilled water. Some reclaimed water is also used to irrigate athletic fields and for toilet flushing. RCW has helped reduce our peaking factors for potable and raw water demands and meets over 10% of our water demand.
Our interconnections with the City of Durham, the Town of Hillsborough, and Chatham County can provide enough water to meet our current average daily water demands. 2. Water Use Information
Service Area
| Sub-Basin(s) | % of Service Population |
|---|
| Haw River (02-1) | 100 % |
|
| County(s) | % of Service Population |
|---|
| Orange | 95 % |
| Durham | 5 % |
|
Population based on April 2020 U.S. Census data for the Towns of Chapel Hill and Carrboro. We estimated the number of dwelling units served outside the town boundaries using information available in our GIS database, available data on the number of dwelling units served by master-meters outside of the town boundaries, and average persons per household for Chapel Hill and Carrboro shown in the 2020 Census. Water Use by Type
| Type of Use |
Metered
Connections |
Metered
Average Use (MGD) |
Non-Metered
Connections |
Non-Metered
Estimated Use (MGD) |
| Residential |
19,765 |
3.3597 |
0 |
0.0000 |
| Commercial |
1,059 |
0.8656 |
0 |
0.0000 |
| Industrial |
0 |
0.0000 |
0 |
0.0000 |
| Institutional |
663 |
1.7252 |
0 |
0.0000 |
How much water was used for system processes (backwash, line cleaning, flushing, etc.)? 0.1142 MGD
The majority of system process water was used to flush distribution lines (approximately 0.07 mgd). Approximately 0..05 mgd of WTP filter was discharged to the sewer system. We recycled approximately 0.42 mgd at the WTP for treatment plant processes. Water Sales
| Purchaser |
PWSID |
Average
Daily Sold
(MGD) |
Days
Used |
Contract |
Required to
comply with water
use restrictions? |
Pipe Size(s)
(Inches) |
Use
Type |
| MGD |
Expiration |
Recurring |
| Chatham County - North |
03-19-126 |
0.0000 |
0 |
0.0000 |
|
No |
No |
16 |
Emergency |
| City of Durham |
03-32-010 |
0.0000 |
0 |
0.0000 |
2029 |
No |
Yes |
16 |
Emergency |
| Town of Cary |
03-92-020 |
0.0000 |
0 |
0.0000 |
2029 |
No |
Yes |
16 |
Emergency |
| Town of Hillsborough |
03-68-015 |
0.0000 |
0 |
0.0000 |
|
Yes |
Yes |
16 |
Emergency |
A mutual aid agreement with the Town of Hillsborough was signed in 1988. There is a section which states that once the Cane Creek Reservoir was online, OWASA expected to be able to provide a maximum of 2 mgd during the original term of agreement, which was 5 years and renews automatically each year unless terminated. This is not viewed as a contractual obligation and is not included as a contractual amount in the table above. Mutual aid agreements with the Town of Cary and the City of Durham have expiration dates and would need new agreements to extend those dates. OWASA and Cary are not directly connected but can provide water to each other by wheeling water through the City of Durham. The interconnection described above with the City of Durham is based on our larger interconnection with Durham near I-40. We also have a second interconnection with Durham that is served by a 12-inch pipe at Hwy 54. 3. Water Supply Sources
Monthly Withdrawals & Purchases
|
Average Daily
Use (MGD) |
Max Day
Use (MGD) |
|
Average Daily
Use (MGD) |
Max Day
Use (MGD) |
|
Average Daily
Use (MGD) |
Max Day
Use (MGD) |
| Jan |
6.4210 |
7.4640 |
May |
6.5550 |
8.0910 |
Sep |
7.0600 |
7.8740 |
| Feb |
6.4520 |
7.0650 |
Jun |
7.6470 |
9.3250 |
Oct |
7.4860 |
8.6480 |
| Mar |
6.4020 |
8.1480 |
Jul |
7.3730 |
9.8610 |
Nov |
6.9210 |
7.8700 |
| Apr |
6.8250 |
7.6280 |
Aug |
7.0860 |
8.8730 |
Dec |
6.0010 |
7.3480 |

Surface Water Sources
| Stream |
Reservoir |
Average Daily Withdrawal |
Maximum Day
Withdrawal (MGD) |
Available Raw
Water Supply |
Usable On-Stream
Raw Water Supply
Storage (MG) |
| MGD |
Days Used |
MGD |
* Qualifier |
| Cane Creek |
Cane Creek Reservoir |
4.5660 |
365 |
6.5660 |
8.5000 |
SY50 |
2,909.0000 |
| Haw River |
Jordan Lake |
0.0000 |
0 |
0.0000 |
5.0000 |
C |
0.0000 |
| Morgan Creek |
University Lake |
2.2860 |
365 |
6.6130 |
2.0000 |
SY50 |
449.0000 |
* Qualifier: C=Contract Amount, SY20=20-year Safe Yield, SY50=50-year Safe Yield, F=20% of 7Q10 or other instream flow requirement, CUA=Capacity Use Area Permit
Surface Water Sources (continued)
| Stream |
Reservoir |
Drainage Area
(sq mi) |
Metered? |
Sub-Basin |
County |
Year
Offline |
Use
Type |
| Cane Creek |
Cane Creek Reservoir |
31 |
Yes |
Haw River (02-1) |
Orange |
|
Regular |
| Haw River |
Jordan Lake |
1,690 |
Yes |
Haw River (02-1) |
Chatham |
|
Emergency |
| Morgan Creek |
University Lake |
30 |
Yes |
Haw River (02-1) |
Orange |
|
Regular |
Yield calculations for Cane Creek Reservoir (CCR), University Lake (UL), and the offline Quarry Reservoir do not reflect 50-year safe yield but rather are based on using the system to maximize water supply by following operating curves (actual operation may deviate from these curves due to varying quality in reservoirs or CIP projects). The estimated yield assumes the following: 1) drought of record (2001-2002), 2) estimated storage adjusted for sediment, 3) 20% storage held in reserve for extreme drought or emergency conditions (i.e., yield is based on 80% of storage), and 4) minimum release from CCR based on 404 permit (minimum release is 2.78 cfs at all times when inflow to reservoir is 3 cfs or greater and is equal to inflow when inflow is less than 3 cfs). There is no minimum release from UL.
Jordan Lake: OWASA has a Level 1 allocation of 5% of the water supply pool (approximately 5 mgd) that we can access through our mutual aid agreements with the Town of Cary and the City of Durham and through the Cary/Durham and Durham/OWASA interconnections. We updated our Long-Range Water Supply Plan in 2022 and Jordan Lake is identified as the best alternative to meet our long-term water supply needs. OWASA is working with the City of Durham, Town of Pittsboro, and Chatham County through the Western Wake Partnership to invest in a new intake, water treatment plant, and transmission infrastructure to meet long-term needs. Water Purchases From Other Systems
| Seller |
PWSID |
Average
Daily Purchased
(MGD) |
Days
Used |
Contract |
Required to
comply with water
use restrictions? |
Pipe Size(s)
(Inches) |
Use
Type |
| MGD |
Expiration |
Recurring |
| Chatham County - North |
03-19-126 |
0.0000 |
0 |
0.0000 |
|
No |
No |
16 |
Emergency |
| City of Durham |
03-32-010 |
1.1450 |
3 |
0.0000 |
2029 |
No |
Yes |
16 |
Emergency |
| Town of Cary |
03-92-020 |
0.0000 |
0 |
0.0000 |
2029 |
No |
Yes |
|
Emergency |
| Town of Hillsborough |
03-68-015 |
0.0000 |
0 |
0.0000 |
|
Yes |
Yes |
16 |
Emergency |
We flush our interconnection with the Town of Hillsborough approximately every two months to ensure it is operational and ready to use should we need it. The flushing water comes from Hillsborough but does not enter our distribution system. In 2024, we flushed a total of 0.35 MG. Water Treatment Plants
| Plant Name |
Permitted Capacity
(MGD) |
Is Raw Water Metered? |
Is Finished Water Ouput Metered? |
Source |
| Jones Ferry Road WTP |
20.0000 |
Yes |
Yes |
Cane Creek Reservoir and University Lake |
OWASA completes an annual Operating Trends Report, which is typically provided to the Board of Directors at their October meeting and is published on our website. This report includes an analysis of future peak day projections of our WTP (and projected max month at our WWTP) to ensure we are preparing for needed hydraulic capacity expansions of our treatment facilities. 4. Wastewater Information
Monthly Discharges
|
Average Daily
Discharge (MGD) |
|
Average Daily
Discharge (MGD) |
|
Average Daily
Discharge (MGD) |
| Jan |
7.0200 |
May |
4.6090 |
Sep |
6.1170 |
| Feb |
5.3670 |
Jun |
3.1020 |
Oct |
4.6950 |
| Mar |
6.4180 |
Jul |
4.1780 |
Nov |
4.5910 |
| Apr |
4.8100 |
Aug |
5.0000 |
Dec |
4.3570 |
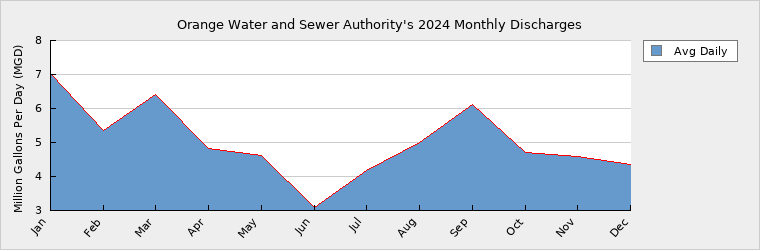
The flows above reflect wastewater effluent discharges to Morgan Creek and do not reflect reclaimed water (RCW) flows, which account for approximately 10% of our water demands on an annual basis. We also use RCW around the WWTP for certain uses such as filter backwash. We also have bulk RCW sales which are not included in the water sales data provided in Section 1.
The number of water service connections with septic systems is estimated from an in-depth analysis we did of our service area to identify parcels not being served by water, sewer, or both and reflects those parcels which are served only by OWASA water. Wastewater Permits
| Permit Number |
Type |
Permitted Capacity
(MGD) |
Design Capacity
(MGD) |
Average Annual
Daily Discharge
(MGD) |
Maximum Day Discharge
(MGD) |
Receiving Stream |
Receiving Basin |
| NC0025241 |
WWTP |
14.5000 |
14.5000 |
5.0220 |
23.6300 |
Morgan Creek |
Haw River (02-1) |
5. Planning
Projections
| |
2024 |
2030 |
2040 |
2050 |
2060 |
2070 |
| Year-Round Population |
86,500 |
96,632 |
106,732 |
116,683 |
126,483 |
136,280 |
| Seasonal Population |
0 |
0 |
0 |
0 |
0 |
0 |
| |
| Residential |
3.3597 |
4.2200 |
4.6200 |
5.1000 |
5.6200 |
6.1400 |
| Commercial |
0.8656 |
1.3400 |
1.5100 |
1.7200 |
1.9900 |
2.2250 |
| Industrial |
0.0000 |
0.0000 |
0.0000 |
0.0000 |
0.0000 |
0.0000 |
| Institutional |
1.7252 |
1.8400 |
2.0600 |
2.3600 |
2.7200 |
3.0900 |
| System Process |
0.1142 |
0.0900 |
0.1000 |
0.1100 |
0.1200 |
0.1400 |
| Unaccounted-for |
0.7780 |
0.6500 |
0.7200 |
0.8100 |
0.9100 |
1.0100 |
Demand projections were updated in 2019 based on population and employment projections developed by Carolina Pines Regional Council (formerly TJCOG) for regional transportation planning. Unit demands (use per dwelling unit or square feet of non-residential space) were estimated from OWASA customer billing data. Demand projections for our LRWSP assumed a given percentage for system process and unaccounted-for water combined (10%). Future Supply Sources
| Source Name |
PWSID |
Source Type |
Additional Supply |
Year Online |
Year Offline |
Type |
| Expanded Quarry Reservoir |
03-68-010 |
Surface |
2.1000 |
2035 |
|
Regular |
| Jordan Lake |
03-68-010 |
Surface |
5.0000 |
2046 |
|
Regular |
OWASA currently has an allocation of 5% of Jordan Lake's water supply pool, but does not have guaranteed, permanent access to it. We can access it on an emergency basis by purchasing water from the Town of Cary and wheeling that water through the City of Durham. OWASA recently completed an update to its Long Range Water Supply Plan and identified Jordan Lake as the best alternative to meet our future needs. We are currently working with the City of Durham, the Town of Pittsboro, and Chatham County to plan, permit, and design a new intake, WTP, and transmission infrastructure.
In 2000, OWASA purchased property adjacent to its existing Quarry Reservoir. This land is currently being quarried through a leasing arrangement with plans to cease all quarry operations by December 31, 2030. After the conclusion of quarry operations, OWASA will connect the two quarry cells to expand the Quarry Reservoir for increased water supply. Demand v/s Percent of Supply
| |
2024 |
2030 |
2040 |
2050 |
2060 |
2070 |
| Surface Water Supply |
10.5000 |
10.5000 |
10.5000 |
10.5000 |
10.5000 |
10.5000 |
| Ground Water Supply |
0.0000 |
0.0000 |
0.0000 |
0.0000 |
0.0000 |
0.0000 |
| Purchases |
0.0000 |
0.0000 |
0.0000 |
0.0000 |
0.0000 |
0.0000 |
| Future Supplies |
0.0000 |
2.1000 |
7.1000 |
7.1000 |
7.1000 |
| Total Available Supply (MGD) |
10.5000 |
10.5000 |
12.6000 |
17.6000 |
17.6000 |
17.6000 |
| Service Area Demand |
6.8427 |
8.1400 |
9.0100 |
10.1000 |
11.3600 |
12.6050 |
| Sales |
0.0000 |
0.0000 |
0.0000 |
0.0000 |
0.0000 |
0.0000 |
| Future Sales |
0.0000 |
0.0000 |
0.0000 |
0.0000 |
0.0000 |
| Total Demand (MGD) |
6.8427 |
8.1400 |
9.0100 |
10.1000 |
11.3600 |
12.6050 |
| Demand as Percent of Supply |
65% |
78% |
72% |
57% |
65% |
72% |

The purpose of the above chart is to show a general indication of how the long-term per capita water demand changes over time. The per capita water demand may actually be different than indicated due to seasonal populations and the accuracy of data submitted. Water systems that have calculated long-term per capita water demand based on a methodology that produces different results may submit their information in the notes field.
Your long-term water demand is 39 gallons per capita per day. What demand management practices do you plan to implement to reduce the per capita water demand (i.e. conduct regular water audits, implement a plumbing retrofit program, employ practices such as rainwater harvesting or reclaimed water)? If these practices are covered elsewhere in your plan, indicate where the practices are discussed here.
The OWASA Board of Directors approved a Water Conservation Plan in September 2022. The plan evaluated AWWA's Water Conservation and Efficiency Program Operation and Management strategies against our current programs and identified short-term next steps. These next steps will be more fully developed as part of the updates to the Water Conservation Plan and Water Shortage Response Plan in FY 2027.
Are there other demand management practices you will implement to reduce your future supply needs? We will be billing in increments smaller than 1,000 gallons to enable customers to better evaluate their water use and even out their monthly water bills. We are also coordinating with the Town of Carrboro, the Town of Chapel Hill, and UNC staff to identify short- and long-term strategies that will help meet goals in each party's respective plans that include elements of water conservation.
What supplies other than the ones listed in future supplies are being considered to meet your future supply needs? OWASA evaluated several other alternatives in our Long Range Water Supply Plan that were either more expensive to implement, did not provide the water needed, or were not legal in NC. Therefore, no other sources are currently being considered.
How does the water system intend to implement the demand management and supply planning components above? OWASA is participating in the planning, permitting, and preliminary design of the proposed intake and transmission infrastructure on Jordan Lake. We have also included projected construction costs for this infrastructure in our 20-year CIP.
Additional Information
Has this system participated in regional water supply or water use planning? Yes, OWASA is an active member of the Triangle Water Supply Partnership (TWP). The TWP hired a consultant to update the Triangle Water Supply Plan, and TWP completed an update of the regional interconnection model, which will help with emergency planning. OWASA is also working with the Western Intake Partnership (City of Durham, Chatham County, and the Town of Pittsboro) to develop a new intake, WTP, and transmission infrastructure on the western side of Jordan Lake.
What major water supply reports or studies were used for planning? OWASA used the 2019 demand projections for the updated Triangle Region Water Supply Plan, which are consistent with the demand projections included in this LWSP.
Please describe any other needs or issues regarding your water supply sources, any water system deficiencies or needed improvements (storage, treatment, etc.) or your ability to meet present and future water needs. Include both quantity and quality considerations, as well as financial, technical, managerial, permitting, and compliance issues: The proposed intake, WTP, and transmission infrastructure on the western side of Jordan Lake will be expensive (our estimated costs in our FY2024 CIP almost doubled from the estimates we had in our FY2023 CIP). In light of more immediate capital improvement needs, including the development of new PFAS treatment infrastructure and a new clearwell, in 2024 OWASA declined to invest as a full financial WIP partner during this phase, deferring our pursuit of this strategic initiative to a future capacity upgrade of the proposed treatment plant and transmission pipelines. Anticipated expenses related to federal PFAS regulation and the need for a new clearwell are placing a significant demand on our CIP budget. These costs will be challenging to cover with manageable rate increases. The OWASA Board of Directors is seeking to balance the need for improvements to our existing infrastructure with costs to our customers to meet long-term water supply needs.
The Division of Water Resources (DWR) provides the data contained within this
Local Water Supply Plan (LWSP) as a courtesy and service to our customers.
DWR staff does not field verify data. Neither DWR, nor any other party
involved in the preparation of this LWSP attests that the data is completely
free of errors and omissions. Furthermore, data users are cautioned that
LWSPs labeled PROVISIONAL have yet to be reviewed by DWR staff. Subsequent
review may result in significant revision. Questions regarding the accuracy
or limitations of usage of this data should be directed to the water system
and/or DWR.
|