|
The Division of Water Resources (DWR) provides the data contained within this
Local Water Supply Plan (LWSP) as a courtesy and service to our customers.
DWR staff does not field verify data. Neither DWR, nor any other party
involved in the preparation of this LWSP attests that the data is completely
free of errors and omissions. Furthermore, data users are cautioned that
LWSPs labeled PROVISIONAL have yet to be reviewed by DWR staff. Subsequent
review may result in significant revision. Questions regarding the accuracy
or limitations of usage of this data should be directed to the water system
and/or DWR.
1. System Information
Contact Information
Complete
| Water System Name: |
Hillsborough |
|
PWSID: |
03-68-015 |
| Mailing Address: | PO Box 429
Hillsborough, NC 27278 | Ownership: | Municipality |
| |
| Contact Person: | K. Marie Strandwitz, PE | Title: | Utilities Director |
| Phone: | 919-296-9631 | Cell/Mobile: | -- |
Distribution System
| Line Type |
Size Range (Inches) |
Estimated % of lines |
| Asbestos Cement |
6-12 |
2.86 % |
| Cast Iron |
2-12 |
7.16 % |
| Ductile Iron |
2-16 |
34.68 % |
| Galvanized Iron |
1.5-3 |
0.76 % |
| Other |
1.5-2 |
0.52 % |
| Polyvinyl Chloride |
2-12 |
54.02 % |
Programs
The town has budgeted $20K per year for the next few years to have outside vendors perform leak detection. The town spent $40K in its last fiscal year to assess its entire system. Town crews addressed every leak noted. Town crews also have leak detection equipment for spot checking suspected leaks. Water system rates naturally lend itself to conservation strategies. As such, it is not something the town is focused upon advocating. Water Conservation
2. Water Use Information
Service Area
| Sub-Basin(s) | % of Service Population |
|---|
| Neuse River (10-1) | 100 % |
|
| County(s) | % of Service Population |
|---|
| Orange | 100 % |
|
Water Use by Type
| Type of Use |
Metered
Connections |
Metered
Average Use (MGD) |
Non-Metered
Connections |
Non-Metered
Estimated Use (MGD) |
| Residential |
6,250 |
0.7509 |
1 |
0.0092 |
| Commercial |
366 |
0.1381 |
0 |
0.0000 |
| Industrial |
8 |
0.0009 |
0 |
0.0000 |
| Institutional |
140 |
0.2796 |
1 |
0.0150 |
How much water was used for system processes (backwash, line cleaning, flushing, etc.)? 0.0783 MGD
Commercial connections include all irrigation accounts. Residential non-metered connections includes 1 for estimated service and main line leaks. Metered connections include compound meter registers which are measured and summarized from both the high and low registers. Institutional includes fire department water use for training and firefighting counted as one unmetered connection in addition to water main breaks. Also, in 2024 some tanks were cleaned and refilled. System process includes hydrant and interconnection flushing, backwashing filters, basin cleaning, sewer jetting, and hydrant flow testing.
In 2024, several fiber companies were working around the water system and there were more than normal strikes to water services and mains, plus the tank cleaning, which is why our unaccounted-for water is higher than normal. Water Sales
| Purchaser |
PWSID |
Average
Daily Sold
(MGD) |
Days
Used |
Contract |
Required to
comply with water
use restrictions? |
Pipe Size(s)
(Inches) |
Use
Type |
| MGD |
Expiration |
Recurring |
| Durham |
03-32-010 |
0.0000 |
0 |
|
|
|
Yes |
12 |
Emergency |
| Orange-Alamance |
03-68-020 |
0.0000 |
0 |
|
|
Yes |
Yes |
6 |
Emergency |
| OWASA |
03-68-010 |
0.0000 |
0 |
|
|
Yes |
Yes |
16 |
Emergency |
3. Water Supply Sources
Monthly Withdrawals & Purchases
|
Average Daily
Use (MGD) |
Max Day
Use (MGD) |
|
Average Daily
Use (MGD) |
Max Day
Use (MGD) |
|
Average Daily
Use (MGD) |
Max Day
Use (MGD) |
| Jan |
1.8180 |
2.0950 |
May |
2.0140 |
2.3360 |
Sep |
2.0180 |
2.4250 |
| Feb |
1.8400 |
2.1900 |
Jun |
2.1516 |
2.4510 |
Oct |
2.1120 |
2.4500 |
| Mar |
1.8920 |
2.0600 |
Jul |
2.0290 |
2.4820 |
Nov |
1.9610 |
2.2890 |
| Apr |
1.9280 |
2.0340 |
Aug |
2.0280 |
2.3110 |
Dec |
1.9200 |
2.0830 |

Surface Water Sources
| Stream |
Reservoir |
Average Daily Withdrawal |
Maximum Day
Withdrawal (MGD) |
Available Raw
Water Supply |
Usable On-Stream
Raw Water Supply
Storage (MG) |
| MGD |
Days Used |
MGD |
* Qualifier |
| Eno River |
Lake Ben Johnston |
1.9800 |
366 |
0.0000 |
1.2130 |
SY20 |
24.0000 |
| West Fork of the Eno River |
West Fork of the Eno Reservoir |
0.0000 |
366 |
0.0000 |
3.0000 |
SY20 |
1,829.0000 |
* Qualifier: C=Contract Amount, SY20=20-year Safe Yield, SY50=50-year Safe Yield, F=20% of 7Q10 or other instream flow requirement, CUA=Capacity Use Area Permit
Surface Water Sources (continued)
| Stream |
Reservoir |
Drainage Area
(sq mi) |
Metered? |
Sub-Basin |
County |
Year
Offline |
Use
Type |
| Eno River |
Lake Ben Johnston |
65 |
Yes |
Neuse River (10-1) |
Orange |
|
Regular |
| West Fork of the Eno River |
West Fork of the Eno Reservoir |
9 |
No |
Neuse River (10-1) |
Orange |
|
Regular |
Per voluntary capacity management agreement 3 cfs is required to be measured at the Hillsborough USGS Eno River gauge. While West Fork of Eno River is listed, it is our run of river supply reservoir and not an intake location. As such, the withdraw is reported as zero. DEQ DWR staff have indicated preference for this to remain as a surface source. Note our intake location at Lake Ben Johnson encompasses West Fork of the Eno River, Lake Orange (owned by Orange County), and Seven Mile Creek plus the Eno River itself. Water Purchases From Other Systems
| Seller |
PWSID |
Average
Daily Purchased
(MGD) |
Days
Used |
Contract |
Required to
comply with water
use restrictions? |
Pipe Size(s)
(Inches) |
Use
Type |
| MGD |
Expiration |
Recurring |
| Durham |
03-32-010 |
0.0000 |
0 |
|
|
Yes |
Yes |
12 |
Emergency |
| Orange-Alamance |
03-68-020 |
0.0000 |
0 |
|
|
Yes |
Yes |
6 |
Emergency |
| OWASA |
03-68-010 |
0.0000 |
0 |
|
|
Yes |
Yes |
16 |
Emergency |
No purchases were made between entities for this year. Water Treatment Plants
| Plant Name |
Permitted Capacity
(MGD) |
Is Raw Water Metered? |
Is Finished Water Ouput Metered? |
Source |
| Hillsborough WTP |
3.0000 |
Yes |
Yes |
Eno River |
4. Wastewater Information
Monthly Discharges
|
Average Daily
Discharge (MGD) |
|
Average Daily
Discharge (MGD) |
|
Average Daily
Discharge (MGD) |
| Jan |
1.6430 |
May |
1.3690 |
Sep |
1.4120 |
| Feb |
1.1830 |
Jun |
0.8860 |
Oct |
0.9550 |
| Mar |
1.4170 |
Jul |
0.9720 |
Nov |
0.9070 |
| Apr |
1.0900 |
Aug |
1.2780 |
Dec |
0.9710 |
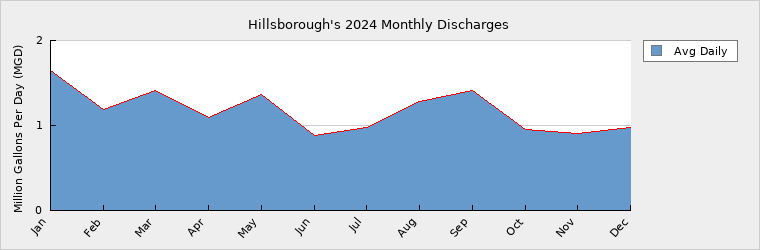
The town is completing a wastewater treatment master plan as it is currently nutrient discharge limited due to Falls Lake Rules. The town is an active participant in the Upper Neuse River Basin Association and is vying for a rules revision as to upgrade our treatment plant for more nutrient removal with little beneficial improvement to Falls Lake is an extreme monetary investment our customers and our financial benchmark obligations cannot support. Wastewater Permits
| Permit Number |
Type |
Permitted Capacity
(MGD) |
Design Capacity
(MGD) |
Average Annual
Daily Discharge
(MGD) |
Maximum Day Discharge
(MGD) |
Receiving Stream |
Receiving Basin |
| NC0026433 |
WWTP |
3.0000 |
3.0000 |
1.2000 |
|
Eno River |
Neuse River (10-1) |
5. Planning
Projections
| |
2024 |
2030 |
2040 |
2050 |
2060 |
2070 |
| Year-Round Population |
19,062 |
21,349 |
25,619 |
30,743 |
36,892 |
36,892 |
| Seasonal Population |
0 |
0 |
0 |
0 |
0 |
0 |
| |
| Residential |
0.7601 |
0.8069 |
0.8913 |
0.9845 |
1.0875 |
1.0875 |
| Commercial |
0.1381 |
0.1423 |
0.1496 |
0.1572 |
0.1653 |
0.1653 |
| Industrial |
0.0009 |
0.1089 |
0.1089 |
0.1089 |
0.1089 |
0.1089 |
| Institutional |
0.2946 |
0.3034 |
0.3186 |
0.3345 |
0.3512 |
0.3512 |
| System Process |
0.0783 |
0.0788 |
0.0796 |
0.0804 |
0.0812 |
0.0820 |
| Unaccounted-for |
0.7080 |
0.7948 |
0.8521 |
0.9144 |
0.9820 |
0.9825 |
The town has a finite water and sewer system boundary established by intergovernmental agreement with surrounding jurisdictions. The wastewater plant is limited in nutrient discharge. The roads through town are limited by lack of space to widen and NCDOT's schedule. Only so much capacity can be accommodated in all infrastructure. Thus it is anticipated that the town will reach its desired capacity by 2060, if not before.
The focus is now on upgrading linear assets. Increasing plant capacity to accommodate growth is not foreseen in the next 15-20 years unless the town board determines it is desired. Based on an analysis of new customer addresses and consumption, consumption is negative than five years earlier likely due to conservation because of high rates. The average residential growth over the last five years was almost 2% per year, however residential service consumption has gone down by a little over 1% per year since 2019.1% growth is assumed for residential.
The non-residential portion reflects even worse on consumption, ranging from being between 10% - 35% less consumption than in 2019 for commercial, institutional and manufacturing accounts. As such, future projections are minimized. An industrial park will be constructed by 2030 that is allocated 108,000 gpd. This has been accounted for by 2030 but no further new industrial activity is anticipated. There may be mixed use developments coming to town so commercial growth consumption, being mostly office and retail, is projected at 0.5% per year as is institutional.
System process water is projected to increase by 0.1% each year although we anticipate a slight decrease next year after the fiber companies are completing boring work around our service area and main and service strikes requiring flushing after repairs are reduced. Demand v/s Percent of Supply
| |
2024 |
2030 |
2040 |
2050 |
2060 |
2070 |
| Surface Water Supply |
4.2130 |
4.2130 |
4.2130 |
4.2130 |
4.2130 |
4.2130 |
| Ground Water Supply |
0.0000 |
0.0000 |
0.0000 |
0.0000 |
0.0000 |
0.0000 |
| Purchases |
0.0000 |
0.0000 |
0.0000 |
0.0000 |
0.0000 |
0.0000 |
| Future Supplies |
0.0000 |
0.0000 |
0.0000 |
0.0000 |
0.0000 |
| Total Available Supply (MGD) |
4.2130 |
4.2130 |
4.2130 |
4.2130 |
4.2130 |
4.2130 |
| Service Area Demand |
1.9800 |
2.2351 |
2.4001 |
2.5799 |
2.7761 |
2.7774 |
| Sales |
0.0000 |
0.0000 |
0.0000 |
0.0000 |
0.0000 |
0.0000 |
| Future Sales |
0.0000 |
0.0000 |
0.0000 |
0.0000 |
0.0000 |
| Total Demand (MGD) |
1.9800 |
2.2351 |
2.4001 |
2.5799 |
2.7761 |
2.7774 |
| Demand as Percent of Supply |
47% |
53% |
57% |
61% |
66% |
66% |

The purpose of the above chart is to show a general indication of how the long-term per capita water demand changes over time. The per capita water demand may actually be different than indicated due to seasonal populations and the accuracy of data submitted. Water systems that have calculated long-term per capita water demand based on a methodology that produces different results may submit their information in the notes field.
Your long-term water demand is 40 gallons per capita per day. What demand management practices do you plan to implement to reduce the per capita water demand (i.e. conduct regular water audits, implement a plumbing retrofit program, employ practices such as rainwater harvesting or reclaimed water)? If these practices are covered elsewhere in your plan, indicate where the practices are discussed here.
Are there other demand management practices you will implement to reduce your future supply needs?
What supplies other than the ones listed in future supplies are being considered to meet your future supply needs?
How does the water system intend to implement the demand management and supply planning components above?
Additional Information
Has this system participated in regional water supply or water use planning? Yes, Yes, We are members of the Triangle Water Partnership which is completing an updated regional interconnection model.
What major water supply reports or studies were used for planning? We used actual consumption records trended over the past five years and are working on a water system master plan document.
Please describe any other needs or issues regarding your water supply sources, any water system deficiencies or needed improvements (storage, treatment, etc.) or your ability to meet present and future water needs. Include both quantity and quality considerations, as well as financial, technical, managerial, permitting, and compliance issues: We received a study grant to look at upgrading our oldest and smallest water tank - Hasell St. and have it in our CIP to expand within the next 5 - 6 years. We expect water system improvements will be recommended with the water system master plan report that include upsizing mains, looping, and adding valves for system redundancy.
As mentioned, we have an increase in unaccounted for water in 2024 due to the many main and service strikes by fiber company boring contractors plus many instances of water theft from hydrants. We expect this to decrease next year when the projects are completed.
The Division of Water Resources (DWR) provides the data contained within this
Local Water Supply Plan (LWSP) as a courtesy and service to our customers.
DWR staff does not field verify data. Neither DWR, nor any other party
involved in the preparation of this LWSP attests that the data is completely
free of errors and omissions. Furthermore, data users are cautioned that
LWSPs labeled PROVISIONAL have yet to be reviewed by DWR staff. Subsequent
review may result in significant revision. Questions regarding the accuracy
or limitations of usage of this data should be directed to the water system
and/or DWR.
|