|
The Division of Water Resources (DWR) provides the data contained within this
Local Water Supply Plan (LWSP) as a courtesy and service to our customers.
DWR staff does not field verify data. Neither DWR, nor any other party
involved in the preparation of this LWSP attests that the data is completely
free of errors and omissions. Furthermore, data users are cautioned that
LWSPs labeled PROVISIONAL have yet to be reviewed by DWR staff. Subsequent
review may result in significant revision. Questions regarding the accuracy
or limitations of usage of this data should be directed to the water system
and/or DWR.
1. System Information
Contact Information
Complete
| Water System Name: |
Lumberton |
|
PWSID: |
03-78-010 |
| Mailing Address: | 1451 Lowery St.
Lumberton, NC 28358 | Ownership: | Municipality |
| |
| Contact Person: | Henry Harper | Title: | Chief Operator |
| Phone: | 910-671-3857 | Cell/Mobile: | 910-301-1278 |
Distribution System
| Line Type |
Size Range (Inches) |
Estimated % of lines |
| Asbestos Cement |
4-16 |
20.00 % |
| Cast Iron |
2-16 |
25.00 % |
| Ductile Iron |
6-24 |
15.00 % |
| Galvanized Iron |
1-2 |
5.00 % |
| Polyvinyl Chloride |
2-12 |
35.00 % |
Programs
Water Conservation
2. Water Use Information
Service Area
| Sub-Basin(s) | % of Service Population |
|---|
| Lumber River (09-1) | 0 % |
|
| County(s) | % of Service Population |
|---|
| Robeson | 0 % |
|
Water Use by Type
| Type of Use |
Metered
Connections |
Metered
Average Use (MGD) |
Non-Metered
Connections |
Non-Metered
Estimated Use (MGD) |
| Residential |
8,035 |
1.8900 |
0 |
0.0000 |
| Commercial |
1,893 |
2.1700 |
6 |
0.5000 |
| Industrial |
31 |
1.8200 |
0 |
0.0000 |
| Institutional |
1 |
0.2610 |
0 |
0.0000 |
How much water was used for system processes (backwash, line cleaning, flushing, etc.)? 0.1250 MGD
After initial review of plan and further discussion it appears there may be an error between monthly-metered water connections and the amount of water withdrawn. Lumberton groundwater withdrawals estimated from one master meter at the plant, individual well withdrawal amounts unavailable and may be the source of the discrepancy. Water Sales
| Purchaser |
PWSID |
Average
Daily Sold
(MGD) |
Days
Used |
Contract |
Required to
comply with water
use restrictions? |
Pipe Size(s)
(Inches) |
Use
Type |
| MGD |
Expiration |
Recurring |
| Robeson Co |
03-78-055 |
0.0470 |
365 |
0.5000 |
|
|
|
8 |
Regular |
No expiration date for the contract with Robeson Co. The contract is self-renewing every 2 years. 3. Water Supply Sources
Monthly Withdrawals & Purchases
|
Average Daily
Use (MGD) |
Max Day
Use (MGD) |
|
Average Daily
Use (MGD) |
Max Day
Use (MGD) |
|
Average Daily
Use (MGD) |
Max Day
Use (MGD) |
| Jan |
7.1800 |
10.1000 |
May |
7.6100 |
9.9000 |
Sep |
7.6000 |
9.3000 |
| Feb |
7.2900 |
9.3000 |
Jun |
7.9800 |
9.8000 |
Oct |
7.4700 |
9.5000 |
| Mar |
7.0000 |
8.6000 |
Jul |
7.6300 |
10.2000 |
Nov |
7.0000 |
8.8900 |
| Apr |
7.0000 |
8.9000 |
Aug |
7.9000 |
10.2000 |
Dec |
7.0000 |
8.9200 |
After initial review of plan and further discussion it appears there may be an error between monthly-metered water connections and the amount of water withdrawn. Lumberton groundwater withdrawals estimated from one master meter at the plant, individual well withdrawal amounts unavailable and may be the source of the discrepancy. 
Ground Water Sources
| Name or Number |
Average Daily Withdrawal (MGD) |
Max Day Withdrawal (MGD) |
12-Hour Supply
(MGD) |
CUA Reduction |
Year Offline |
Use Type |
| MGD |
Days Used |
| 1 |
0.8650 |
183 |
0.865 |
0.8650 |
|
|
Regular |
| 2 |
0.8650 |
183 |
0.865 |
0.8650 |
|
|
Regular |
| 3 |
0.0000 |
0 |
0 |
0.0000 |
|
|
Regular |
| 4 |
1.0000 |
183 |
1.000 |
1.0000 |
|
|
Regular |
| 5 |
0.8650 |
183 |
0.865 |
0.8650 |
|
|
Regular |
| 6 |
1.0000 |
183 |
1.000 |
1.0000 |
|
|
Regular |
| 7 |
1.0000 |
183 |
1.000 |
1.0000 |
|
|
Regular |
Ground Water Sources (continued)
| Name or Number |
Well Depth (Feet) |
Casing Depth
(Feet) |
Screen Depth (Feet) |
Well Diameter (Inches) |
Pump Intake Depth (Feet) |
Metered? |
| Top |
Bottom |
| 1 |
104 |
40 |
70 |
90 |
12 |
0 |
Yes |
| 2 |
120 |
40 |
65 |
115 |
10 |
0 |
Yes |
| 3 |
122 |
0 |
0 |
0 |
12 |
0 |
No |
| 4 |
160 |
40 |
70 |
150 |
12 |
0 |
Yes |
| 5 |
163 |
40 |
70 |
155 |
12 |
0 |
Yes |
| 6 |
160 |
40 |
70 |
150 |
12 |
0 |
Yes |
| 7 |
162 |
40 |
70 |
155 |
12 |
0 |
Yes |
Well #3 is permanently offline. After initial review of plan and further discussion it appears there may be an error between monthly-metered water connections and the amount of water withdrawn. Lumberton groundwater withdrawals estimated from one master meter at the plant, individual well withdrawal amounts unavailable and may be the source of the discrepancy. Surface Water Sources
| Stream |
Reservoir |
Average Daily Withdrawal |
Maximum Day
Withdrawal (MGD) |
Available Raw
Water Supply |
Usable On-Stream
Raw Water Supply
Storage (MG) |
| MGD |
Days Used |
MGD |
* Qualifier |
| Lumber River |
none |
7.3900 |
365 |
10.2000 |
16.0000 |
F |
0.0000 |
* Qualifier: C=Contract Amount, SY20=20-year Safe Yield, SY50=50-year Safe Yield, F=20% of 7Q10 or other instream flow requirement, CUA=Capacity Use Area Permit
Surface Water Sources (continued)
| Stream |
Reservoir |
Drainage Area
(sq mi) |
Metered? |
Sub-Basin |
County |
Year
Offline |
Use
Type |
| Lumber River |
none |
714 |
Yes |
Lumber River (09-1) |
Robeson |
|
Regular |
Water Purchases From Other Systems
| Seller |
PWSID |
Average
Daily Purchased
(MGD) |
Days
Used |
Contract |
Required to
comply with water
use restrictions? |
Pipe Size(s)
(Inches) |
Use
Type |
| MGD |
Expiration |
Recurring |
| Robeson Co |
03-78-055 |
0.0000 |
0 |
0.0000 |
|
|
|
8 |
Emergency |
Water Treatment Plants
| Plant Name |
Permitted Capacity
(MGD) |
Is Raw Water Metered? |
Is Finished Water Ouput Metered? |
Source |
| Lumberton |
16.0000 |
Yes |
Yes |
Lumber River |
4. Wastewater Information
Monthly Discharges
|
Average Daily
Discharge (MGD) |
|
Average Daily
Discharge (MGD) |
|
Average Daily
Discharge (MGD) |
| Jan |
5.7000 |
May |
4.4900 |
Sep |
5.4700 |
| Feb |
5.8900 |
Jun |
4.8100 |
Oct |
5.7800 |
| Mar |
5.8600 |
Jul |
5.1700 |
Nov |
6.2400 |
| Apr |
5.3300 |
Aug |
5.4800 |
Dec |
6.0300 |
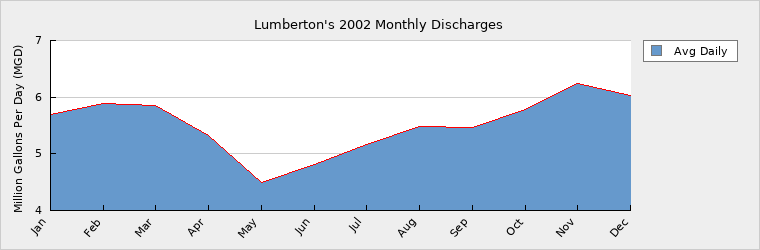
All water meters do not have corresponding sewer connections; likewise there are sewer meters without a corresponding water connection. Additionally, there are irrigation (sprinkler) meters which would further skew the sewer connection and septic system totals. Wastewater Permits
| Permit Number |
Type |
Permitted Capacity
(MGD) |
Design Capacity
(MGD) |
Average Annual
Daily Discharge
(MGD) |
Maximum Day Discharge
(MGD) |
Receiving Stream |
Receiving Basin |
| NC00086738 |
|
1.6000 |
1.6000 |
1.0000 |
0.5000 |
Lumber River |
Lumber River (09-1) |
| NC0024571 |
|
20.0000 |
20.0000 |
5.5200 |
6.2400 |
Lumber River |
Lumber River (09-1) |
| WQ0000672 |
|
0.0310 |
0.0310 |
0.0260 |
0.0000 |
Lumber River |
Lumber River (09-1) |
The Waste Treatment Plant has been upgraded to 20 MGD capacity. (completed 2002). NC00086738 permit has been terminated and is no longer valid. 5. Planning
Projections
| |
2002 |
2010 |
2020 |
2030 |
| Year-Round Population |
22,500 |
25,000 |
29,000 |
34,000 |
| Seasonal Population |
0 |
0 |
0 |
0 |
| |
| Residential |
1.8900 |
2.5700 |
2.9780 |
3.3800 |
| Commercial |
2.6700 |
3.1000 |
4.2300 |
5.4600 |
| Industrial |
1.8200 |
2.2100 |
2.4300 |
2.8020 |
| Institutional |
0.2610 |
0.2760 |
0.2940 |
0.3030 |
| System Process |
0.1250 |
0.1360 |
0.1480 |
0.1780 |
| Unaccounted-for |
3.3822 |
0.6500 |
0.7500 |
0.9000 |
Unaccounted-for water projections for 2010-2050 projected based on 2002 usage and projected population. Demand v/s Percent of Supply
| |
2002 |
2010 |
2020 |
2030 |
| Surface Water Supply |
16.0000 |
16.0000 |
16.0000 |
16.0000 |
| Ground Water Supply |
5.5950 |
5.5950 |
5.5950 |
5.5950 |
| Purchases |
0.0000 |
0.0000 |
0.0000 |
0.0000 |
| Future Supplies |
0.0000 |
0.0000 |
0.0000 |
| Total Available Supply (MGD) |
21.5950 |
21.5950 |
21.5950 |
21.5950 |
| Service Area Demand |
10.1482 |
8.9420 |
10.8300 |
13.0230 |
| Sales |
0.0470 |
0.5000 |
0.5000 |
0.5000 |
| Future Sales |
0.0000 |
0.0000 |
0.0000 |
| Total Demand (MGD) |
10.1952 |
9.4420 |
11.3300 |
13.5230 |
| Demand as Percent of Supply |
47% |
44% |
52% |
63% |

The purpose of the above chart is to show a general indication of how the long-term per capita water demand changes over time. The per capita water demand may actually be different than indicated due to seasonal populations and the accuracy of data submitted. Water systems that have calculated long-term per capita water demand based on a methodology that produces different results may submit their information in the notes field.
Your long-term water demand is 84 gallons per capita per day. What demand management practices do you plan to implement to reduce the per capita water demand (i.e. conduct regular water audits, implement a plumbing retrofit program, employ practices such as rainwater harvesting or reclaimed water)? If these practices are covered elsewhere in your plan, indicate where the practices are discussed here.
Are there other demand management practices you will implement to reduce your future supply needs?
What supplies other than the ones listed in future supplies are being considered to meet your future supply needs?
How does the water system intend to implement the demand management and supply planning components above?
Additional Information
Has this system participated in regional water supply or water use planning? Yes
What major water supply reports or studies were used for planning? All major reports were prepared through the Lumber River COG. This includes the Regional Wastewater Feasibility Study for
blabem, Columbus, Hoke, Robesob, And Scotland Counties.
Please describe any other needs or issues regarding your water supply sources, any water system deficiencies or needed improvements (storage, treatment, etc.) or your ability to meet present and future water needs. Include both quantity and quality considerations, as well as financial, technical, managerial, permitting, and compliance issues: Plant capacity is expandable to 32 MGD. Water Supply is not an issue at this time.System improvements will include upgrade of raw water pumping station, looping together of main water lines, and filter repairs.
The Division of Water Resources (DWR) provides the data contained within this
Local Water Supply Plan (LWSP) as a courtesy and service to our customers.
DWR staff does not field verify data. Neither DWR, nor any other party
involved in the preparation of this LWSP attests that the data is completely
free of errors and omissions. Furthermore, data users are cautioned that
LWSPs labeled PROVISIONAL have yet to be reviewed by DWR staff. Subsequent
review may result in significant revision. Questions regarding the accuracy
or limitations of usage of this data should be directed to the water system
and/or DWR.
|